Statistik Asas
| Pemilik Institusi | 170 total, 170 long only, 0 short only, 0 long/short - change of 2.41% MRQ |
| Purata Peruntukan Portfolio | 0.5269 % - change of -5.86% MRQ |
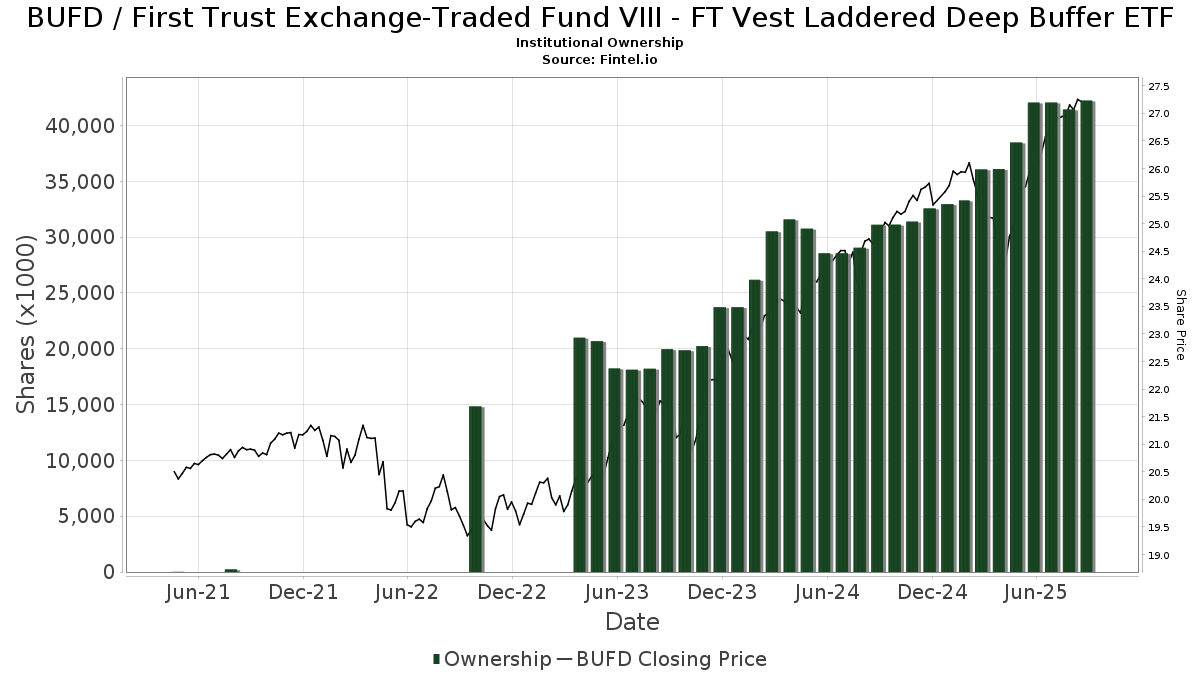
| Saham Institusi (Panjang) | 42,232,745 (ex 13D/G) - change of 0.18MM shares 0.43% MRQ |
| Nilai Institusi (Panjang) | $ 1,047,218 USD ($1000) |
Pemilikan Institusi dan Pemegang Saham
First Trust Exchange-Traded Fund VIII - FT Vest Laddered Deep Buffer ETF (US:BUFD) telah 170 pemilik institusi dan pemegang saham yang telah memfailkan borang 13D/G atau 13F dengan Suruhanjaya Bursa Sekuriti (SEC). Institusi ini memegang sejumlah 42,232,745 saham. Pemegang saham terbesar termasuk LPL Financial LLC, Gw Henssler & Associates Ltd, Envestnet Asset Management Inc, Legacy Financial Group LLC, Centennial Wealth Advisory LLC, Advisor Group Holdings, Inc., Creekmur Asset Management LLC, Truist Financial Corp, Cetera Investment Advisers, and Commonwealth Equity Services, Llc .
First Trust Exchange-Traded Fund VIII - FT Vest Laddered Deep Buffer ETF (BATS:BUFD) struktur pemilikan institusi menunjukkan kedudukan semasa dalam syarikat mengikut institusi dan dana serta perubahan terkini dalam saiz kedudukan. Pemegang saham utama boleh termasuk pelabur individu, dana amanah, dana lindung nilai atau institusi. Jadual 13D menunjukkan bahawa pelabur memegang (atau menahan) lebih daripada 5% syarikat dan berhasrat (atau berniat) untuk secara aktif meneruskan perubahan dalam strategi perniagaan. Jadual 13G menunjukkan pelaburan pasif melebihi 5%.
The share price as of September 5, 2025 is 27.30 / share. Previously, on September 9, 2024, the share price was 24.56 / share. This represents an increase of 11.16% over that period.
Skor Sentimen Dana
Skor Sentimen Dana (Skor Pengumpulan Pemilikan fka) mencari saham yang paling banyak dibeli oleh dana. Ia adalah hasil daripada model kuantitatif pelbagai faktor yang canggih yang mengenal pasti syarikat dengan tahap pengumpulan institusi tertinggi. Model pemarkahan ini menggunakan gabungan jumlah kenaikan dalam pemilik yang didedahkan, perubahan dalam peruntukan portfolio dalam pemilik tersebut dan metrik lain. Nombornya berjulat dari 0 hingga 100, dengan nombor yang lebih tinggi menunjukkan tahap pengumpulan yang lebih tinggi kepada rakannya, dan 50 adalah nombor purata.
Kekerapan Kemas Kini: Harian
Lihat Peneroka Pemilikan yang menyediakan senarai syarikat yang mempunyai kedudukan tertinggi.
Nisbah Put/Call Institusi
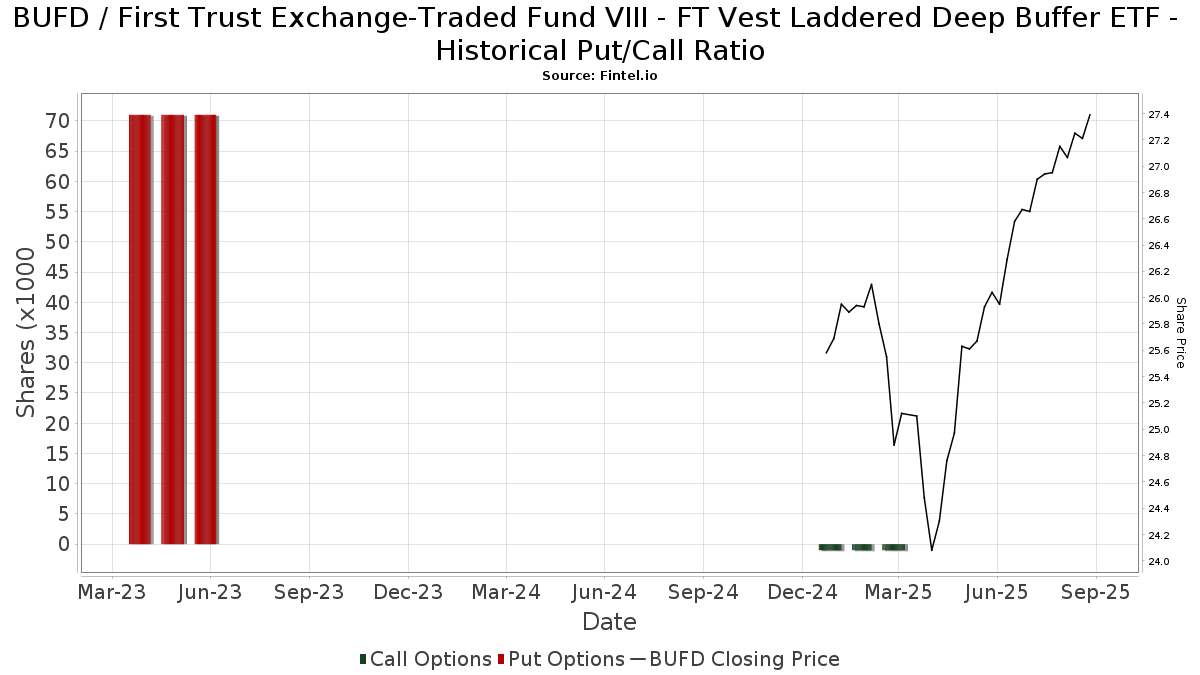
Selain melaporkan isu ekuiti dan hutang standard, institusi yang mempunyai lebih daripada 100MM aset di bawah pengurusan juga mesti mendedahkan pegangan opsyen jual dan beli mereka. Memandangkan opsyen jual secara amnya menunjukkan sentimen negatif, dan opsyen beli menunjukkan sentimen positif, kita boleh mendapatkan gambaran keseluruhan sentimen institusi dengan merencanakan nisbah jual kepada beli. Carta di sebelah kanan memplotkan nisbah jual/beli sejarah untuk instrumen ini.
Menggunakan Nisbah Put/Callsebagai penunjuk sentimen pelabur mengatasi salah satu kekurangan utama menggunakan jumlah pemilikan institusi, iaitu sejumlah besar aset di bawah pengurusan dilaburkan secara pasif untuk menjejaki indeks. Dana yang diurus secara pasif biasanya tidak membeli opsyen, jadi penunjuk nisbah put/call mengekori rapat sentimen dana yang diurus secara aktif.
Pemfailan 13F dan NPORT
Butiran mengenai pemfailan 13F adalah percuma. Perincian mengenai pemfailan NP memerlukan keahlian premium. Baris hijau menunjukkan kedudukan baharu. Baris merah menunjukkan kedudukan tertutup. Klik pautan ikon untuk melihat sejarah transaksi penuh.
Naik Taraf
untuk membuka data premium dan mengeksport ke Excel ![]() .
.
| Tarikh Fail | Sumber | Pelabur | Jenis | Purata Harga (Ang) |
Saham | ΔSaham (%) |
Nilai Dilaporkan ($1000) |
Δ Nilai (%) |
Peruntukan Port (%) |
|
|---|---|---|---|---|---|---|---|---|---|---|
| 2025-08-05 | 13F | EPG Wealth Management LLC | Call | 0 | -100.00 | 0 | ||||
| 2025-08-05 | 13F | American Institute for Advanced Investment Management, LLP | 30,572 | -1.98 | 812 | 4.24 | ||||
| 2025-08-13 | 13F | Northwestern Mutual Wealth Management Co | 2,972 | 79 | ||||||
| 2025-07-14 | 13F | Iams Wealth Management, Llc | 46,230 | -61.62 | 1,228 | -59.17 | ||||
| 2025-08-05 | 13F | EPG Wealth Management LLC | 0 | -100.00 | 0 | |||||
| 2025-08-12 | 13F | Cornerstone Wealth Management, LLC | 7,819 | 208 | ||||||
| 2025-07-23 | 13F | GGM Financials LLC | 16,198 | 430 | ||||||
| 2025-08-05 | 13F | C2P Capital Advisory Group, LLC d.b.a. Prosperity Capital Advisors | 25,131 | 667 | ||||||
| 2025-08-08 | 13F | Kingsview Wealth Management, LLC | 81,531 | -0.67 | 2,165 | 5.76 | ||||
| 2025-08-12 | 13F | Jacobi Capital Management LLC | 200,363 | 7.74 | 5,322 | 14.70 | ||||
| 2025-07-11 | 13F | Farther Finance Advisors, LLC | 5,251 | 232.76 | 139 | 256.41 | ||||
| 2025-07-28 | 13F | RFG Advisory, LLC | 17,969 | 48.14 | 477 | 57.95 | ||||
| 2025-07-22 | 13F | Partners Wealth Management, Llc | 18,296 | 0.00 | 457 | 0.00 | ||||
| 2025-08-18 | 13F | N.E.W. Advisory Services LLC | 2,105 | -65.41 | 56 | -63.58 | ||||
| 2025-04-29 | 13F | Resources Investment Advisors, LLC. | 0 | -100.00 | 0 | |||||
| 2025-07-07 | 13F | Schulz Wealth, LTD. | 8,628 | -36.87 | 229 | -32.84 | ||||
| 2025-07-10 | 13F | Wealth Enhancement Advisory Services, Llc | 18,853 | -45.60 | 503 | -41.78 | ||||
| 2025-04-21 | 13F | Nelson, Van Denburg & Campbell Wealth Management Group, LLC | 0 | -100.00 | 0 | |||||
| 2025-08-13 | 13F | StoneX Group Inc. | 53,431 | 236.64 | 1,419 | 258.33 | ||||
| 2025-04-15 | 13F | Integrated Advisors Network LLC | 0 | -100.00 | 0 | |||||
| 2025-08-14 | 13F | Wells Fargo & Company/mn | 58,263 | -12.79 | 1,547 | -7.14 | ||||
| 2025-08-11 | 13F | Summit Wealth Partners, LLC | 8,243 | 0.00 | 219 | 6.34 | ||||
| 2025-07-30 | 13F | Onyx Bridge Wealth Group LLC | 15,100 | 0.00 | 401 | 6.65 | ||||
| 2025-07-16 | 13F | Maridea Wealth Management LLC | 44,119 | 9.73 | 1,172 | 16.75 | ||||
| 2025-08-06 | 13F | AE Wealth Management LLC | 41,523 | -3.81 | 1,103 | 2.32 | ||||
| 2025-07-30 | 13F | Paul Damon & Associates, Inc. | 53,960 | 3.92 | 1,433 | 10.66 | ||||
| 2025-08-14 | 13F | Mariner, LLC | 324,697 | -15.97 | 8,624 | -10.55 | ||||
| 2025-05-15 | 13F/A | Orion Portfolio Solutions, LLC | 28,450 | -19.51 | 710 | -21.40 | ||||
| 2025-08-14 | 13F | Integrated Wealth Concepts LLC | 134,982 | 15.26 | 3,585 | 22.73 | ||||
| 2025-08-13 | 13F | Capital Analysts, Inc. | 33,980 | 1.14 | 1 | |||||
| 2025-08-06 | 13F | Legacy Investment Solutions, LLC | 106,530 | 57.91 | 2,829 | 62.12 | ||||
| 2025-07-09 | 13F | Tounjian Advisory Partners, Llc | 34,163 | 0.00 | 852 | 0.00 | ||||
| 2025-08-14 | 13F | Harvest Investment Services, LLC | 21,454 | -5.31 | 570 | 0.71 | ||||
| 2025-08-12 | 13F | Indie Asset Partners, LLC | 0 | -100.00 | 0 | |||||
| 2025-08-04 | 13F | L.m. Kohn & Company | 28,226 | -4.34 | 750 | 1.77 | ||||
| 2025-07-25 | 13F | Envestnet Portfolio Solutions, Inc. | 8,196 | -93.52 | 218 | -93.13 | ||||
| 2025-05-21 | 13F/A | Geneos Wealth Management Inc. | 0 | -100.00 | 0 | -100.00 | ||||
| 2025-08-12 | 13F | Jpmorgan Chase & Co | 4 | -99.98 | 0 | -100.00 | ||||
| 2025-07-22 | 13F | Simplicity Wealth,LLC | 202,770 | 73.22 | 5,386 | 84.42 | ||||
| 2025-08-12 | 13F | Gladstone Institutional Advisory LLC | 23,507 | -68.43 | 624 | -66.40 | ||||
| 2025-08-13 | 13F | Townsquare Capital Llc | 0 | -100.00 | 0 | |||||
| 2025-07-31 | 13F | Moloney Securities Asset Management, LLC | 17,985 | 3.42 | 478 | 10.16 | ||||
| 2025-08-11 | 13F | Brass Tax Wealth Management, Inc | 425,004 | 5.19 | 11,288 | 11.98 | ||||
| 2025-08-11 | 13F | Principal Securities, Inc. | 53,075 | 20.77 | 1,410 | 25.69 | ||||
| 2025-07-16 | 13F | Essex Financial Services, Inc. | 8,902 | 0.00 | 236 | 6.31 | ||||
| 2025-08-14 | 13F | Schwallier Wealth Management LLC | 0 | -100.00 | 0 | -100.00 | ||||
| 2025-07-30 | 13F | LifeWealth Investments, LLC | 36,581 | 2.24 | 972 | 8.86 | ||||
| 2025-08-19 | 13F | Advisory Services Network, LLC | 174,066 | 9.40 | 4,679 | 17.86 | ||||
| 2025-05-12 | 13F | Independent Advisor Alliance | 0 | -100.00 | 0 | |||||
| 2025-08-06 | 13F | Commonwealth Equity Services, Llc | 767,257 | -24.33 | 20 | -20.00 | ||||
| 2025-08-11 | 13F | Aptus Capital Advisors, LLC | 1,150 | 0.00 | 31 | 7.14 | ||||
| 2025-08-13 | 13F | SCS Capital Management LLC | 16,152 | 1.23 | 429 | 7.54 | ||||
| 2025-09-04 | 13F/A | Advisor Group Holdings, Inc. | 1,756,473 | 6.87 | 46,652 | 13.77 | ||||
| 2025-08-08 | 13F | Avantax Advisory Services, Inc. | 83,669 | 1.02 | 2,222 | 7.55 | ||||
| 2025-08-13 | 13F | Mayfair Advisory Group, LLC | 25,583 | 0.00 | 692 | 8.31 | ||||
| 2025-08-08 | 13F | Foundations Investment Advisors, LLC | 50,158 | -11.26 | 1,332 | -5.53 | ||||
| 2025-08-14 | 13F | Jane Street Group, Llc | 31,794 | -59.93 | 844 | -57.35 | ||||
| 2025-07-18 | 13F | Cooper Financial Group | 19,481 | -8.95 | 517 | -3.00 | ||||
| 2025-08-04 | 13F | Creekmur Asset Management LLC | 1,490,215 | 3.48 | 39,580 | 10.16 | ||||
| 2025-05-08 | 13F | Us Bancorp \de\ | 0 | -100.00 | 0 | |||||
| 2025-07-23 | 13F | Defined Financial Planning LLC | 15,587 | 415 | ||||||
| 2025-07-25 | 13F | We Are One Seven, LLC | 33,913 | 901 | ||||||
| 2025-08-04 | 13F | IFG Advisory, LLC | 88,748 | -16.37 | 2,357 | -10.96 | ||||
| 2025-07-30 | 13F | Strategic Blueprint, LLC | 26,213 | -19.36 | 696 | -14.18 | ||||
| 2025-07-15 | 13F | Santori & Peters, Inc. | 391,090 | 0.04 | 10,387 | 6.50 | ||||
| 2025-07-16 | 13F | Cambridge Advisors Inc. | 17,467 | -5.92 | 464 | 0.00 | ||||
| 2025-07-24 | 13F | Fischer Investment Strategies, Llc | 569,210 | 17.00 | 15,118 | 24.56 | ||||
| 2025-08-13 | 13F | Maia Wealth LLC | 82,743 | -33.99 | 2,198 | -28.30 | ||||
| 2025-08-14 | 13F | Benjamin Edwards Inc | 15,058 | -24.04 | 400 | -19.23 | ||||
| 2025-08-12 | 13F | Richmond Investment Services, LLC | 117,842 | 107.11 | 3,130 | 120.51 | ||||
| 2025-08-06 | 13F | Wedbush Securities Inc | 166,343 | -39.70 | 4 | -33.33 | ||||
| 2025-07-08 | 13F | Nbc Securities, Inc. | 27,898 | -1.98 | 1 | |||||
| 2025-08-04 | 13F | Atria Investments Llc | 16,280 | 432 | ||||||
| 2025-07-07 | 13F | Nova Wealth Management, Inc. | 469 | -52.24 | 12 | -50.00 | ||||
| 2025-08-14 | 13F | Old Mission Capital Llc | 22,791 | 605 | ||||||
| 2025-07-07 | 13F | Capital Asset Advisory Services LLC | 738,615 | 4.35 | 19,588 | 10.26 | ||||
| 2025-08-08 | 13F | Cetera Investment Advisers | 1,019,430 | 4.40 | 27,076 | 11.14 | ||||
| 2025-08-08 | 13F | SBI Securities Co., Ltd. | 2 | -33.33 | 0 | |||||
| 2025-08-06 | 13F | Golden State Wealth Management, LLC | 10,280 | 0.00 | 273 | 6.64 | ||||
| 2025-07-14 | 13F | Chris Bulman Inc | 9,704 | -13.81 | 258 | -8.21 | ||||
| 2025-08-06 | 13F | Wsfs Capital Management, Llc | 8,146 | 0.00 | 216 | 6.40 | ||||
| 2025-07-14 | 13F | Sowell Financial Services LLC | 21,879 | -14.29 | 581 | -8.65 | ||||
| 2025-08-06 | 13F | Walkner Condon Financial Advisors LLC | 53,124 | -25.73 | 1,411 | -20.96 | ||||
| 2025-08-19 | 13F | National Asset Management, Inc. | 0 | -100.00 | 0 | |||||
| 2025-08-11 | 13F | Perennial Investment Advisors, LLC | 112,101 | 2,977 | ||||||
| 2025-07-22 | 13F | Merit Financial Group, LLC | 12,854 | 0.00 | 341 | 6.56 | ||||
| 2025-08-15 | 13F | Morgan Stanley | 23,246 | 2,052.41 | 617 | 2,273.08 | ||||
| 2025-05-15 | 13F | Concorde Asset Management, LLC | 17,354 | 13.75 | 425 | 9.00 | ||||
| 2025-07-02 | 13F | HBW Advisory Services LLC | 10,766 | 0.00 | 286 | 6.34 | ||||
| 2025-03-21 | 13F | Prostatis Group LLC | 0 | -100.00 | 0 | |||||
| 2025-07-11 | 13F | Quad-Cities Investment Group, LLC | 14,538 | 0.00 | 386 | 6.63 | ||||
| 2025-07-21 | 13F | Ameritas Advisory Services, LLC | 12,656 | -64.82 | 336 | -62.63 | ||||
| 2025-08-20 | 13F/A | Coppell Advisory Solutions LLC | 659,729 | 32.17 | 17,437 | 40.98 | ||||
| 2025-07-21 | 13F | Triad Wealth Partners, LLC | 24,522 | 149.97 | 651 | 166.80 | ||||
| 2025-08-15 | 13F | Equitable Holdings, Inc. | 80,799 | 7.28 | 2,146 | 14.21 | ||||
| 2025-08-07 | 13F | Kestra Private Wealth Services, Llc | 721,868 | 535.98 | 19,173 | 577.22 | ||||
| 2025-07-21 | 13F | Andina Capital Management, LLC | 0 | -100.00 | 0 | |||||
| 2025-05-02 | 13F | Apollon Wealth Management, LLC | 0 | -100.00 | 0 | -100.00 | ||||
| 2025-08-05 | 13F | Claro Advisors LLC | 41,916 | 16.54 | 1,113 | 24.08 | ||||
| 2025-07-28 | 13F | Mutual Advisors, LLC | 14,995 | -13.55 | 404 | -5.61 | ||||
| 2025-08-14 | 13F | Great Valley Advisor Group, Inc. | 11,596 | -1.29 | 308 | 5.14 | ||||
| 2025-07-17 | 13F | Albion Financial Group /ut | 358 | 0.00 | 10 | 12.50 | ||||
| 2025-07-30 | 13F | IMG Wealth Management, Inc. | 275,408 | 4.12 | 7,315 | 10.83 | ||||
| 2025-08-13 | 13F | Twin Peaks Wealth Advisors, LLC | 13,188 | 45.71 | 358 | 62.27 | ||||
| 2025-08-08 | 13F | Larson Financial Group LLC | 1,220 | 0.00 | 32 | 6.67 | ||||
| 2025-07-25 | 13F | Cwm, Llc | 275,091 | 0.80 | 7 | 16.67 | ||||
| 2025-08-08 | 13F | Symphony Financial Services, Inc. | 17,475 | 12.92 | 464 | 20.21 | ||||
| 2025-08-14 | 13F | GWM Advisors LLC | 439,981 | -7.90 | 11,686 | -1.96 | ||||
| 2025-07-10 | 13F | Focus Financial Network, Inc. | 15,024 | 0.00 | 399 | 6.68 | ||||
| 2025-07-24 | 13F | Cascade Investment Group, Inc. | 9,680 | -1.56 | 257 | 4.90 | ||||
| 2025-08-05 | 13F | Strategic Financial Concepts, LLC | 18,566 | -3.61 | 493 | 2.71 | ||||
| 2025-07-30 | 13F | TFB Advisors LLC | 18,547 | -23.65 | 493 | -18.81 | ||||
| 2025-05-07 | 13F | Prosperity Consulting Group, LLC | 0 | -100.00 | 0 | |||||
| 2025-08-04 | 13F | Assetmark, Inc | 4,146 | 14.91 | 110 | 22.22 | ||||
| 2025-07-18 | 13F | Truist Financial Corp | 1,128,503 | 1.59 | 29,973 | 8.15 | ||||
| 2025-07-24 | 13F | IFP Advisors, Inc | 27,671 | 8.92 | 735 | 15.96 | ||||
| 2025-07-25 | 13F | Lion Street Advisors, LLC | 25,086 | -4.39 | 666 | 1.83 | ||||
| 2025-07-29 | 13F | Private Trust Co Na | 10,361 | 6.51 | 275 | 13.64 | ||||
| 2025-08-05 | 13F | Milestone Asset Management, Llc | 418,721 | 34.43 | 11,121 | 43.11 | ||||
| 2025-07-31 | 13F | Cambridge Investment Research Advisors, Inc. | 649,420 | -34.62 | 17 | -29.17 | ||||
| 2025-07-28 | 13F | Axxcess Wealth Management, Llc | 702,397 | 4.40 | 18,656 | 11.13 | ||||
| 2025-08-11 | 13F | Regal Investment Advisors LLC | 10,549 | 0.00 | 280 | 6.46 | ||||
| 2025-07-25 | 13F | Atria Wealth Solutions, Inc. | 33,946 | -80.97 | 902 | -79.75 | ||||
| 2025-08-01 | 13F | Wealth Watch Advisors, INC | 103,704 | 42.44 | 2,754 | 51.65 | ||||
| 2025-08-12 | 13F | Proequities, Inc. | 0 | 0 | ||||||
| 2025-05-02 | 13F | BlackRock, Inc. | 0 | -100.00 | 0 | |||||
| 2025-08-11 | 13F | Blue Bell Private Wealth Management, Llc | 235 | 0.00 | 6 | 20.00 | ||||
| 2025-07-18 | 13F | Trilogy Capital Inc. | 12,470 | 0.00 | 331 | 6.43 | ||||
| 2025-08-14 | 13F | Core Wealth Advisors, Inc. | 8,105 | 215 | ||||||
| 2025-07-16 | 13F | EdgeRock Capital LLC | 27,524 | 0.00 | 731 | 6.56 | ||||
| 2025-08-06 | 13F | Prospera Financial Services Inc | 7,926 | 211 | ||||||
| 2025-08-12 | 13F | Change Path, LLC | 277,959 | -0.72 | 7,383 | 5.68 | ||||
| 2025-08-14 | 13F | Mml Investors Services, Llc | 756,648 | -5.63 | 20 | 0.00 | ||||
| 2025-08-15 | 13F | Kestra Advisory Services, LLC | 428,889 | -0.27 | 11,391 | 6.16 | ||||
| 2025-08-05 | 13F | Integrity Financial Corp /WA | 219,828 | -12.86 | 5,839 | -7.24 | ||||
| 2025-07-24 | 13F | SLT Holdings LLC | 44,764 | -7.75 | 1,189 | -1.82 | ||||
| 2025-07-28 | 13F | Virtus Wealth Solutions LLC | 16,198 | 1.36 | 430 | 8.04 | ||||
| 2025-07-30 | 13F | Brookstone Capital Management | 750,871 | -0.41 | 19,943 | 6.02 | ||||
| 2025-08-12 | 13F | LPL Financial LLC | 8,066,365 | 2.80 | 214,243 | 9.43 | ||||
| 2025-08-14 | 13F | Ausdal Financial Partners, Inc. | 8,991 | -0.59 | 239 | 5.78 | ||||
| 2025-08-14 | 13F | CoreCap Advisors, LLC | 41,733 | -9.11 | 1,108 | -3.23 | ||||
| 2025-08-14 | 13F | Financial Strategies Group, Inc. | 41,511 | 4.89 | 1,107 | 14.83 | ||||
| 2025-08-12 | 13F | Tradition Wealth Management, LLC | 66,961 | -2.76 | 1,778 | 3.49 | ||||
| 2025-08-14 | 13F | Planwiser Financial, Llc | 16,779 | 15.46 | 452 | 24.86 | ||||
| 2025-07-17 | 13F | Janney Montgomery Scott LLC | 20,727 | 1.45 | 1 | |||||
| 2025-07-25 | 13F | Gw Henssler & Associates Ltd | 3,959,449 | -6.91 | 105,163 | -0.90 | ||||
| 2025-08-12 | 13F | Steward Partners Investment Advisory, Llc | 36,385 | 25.46 | 966 | 33.61 | ||||
| 2025-08-05 | 13F | GPS Wealth Strategies Group, LLC | 66,202 | 15.52 | 1,758 | 23.02 | ||||
| 2025-08-05 | 13F | Bank Of Montreal /can/ | 150 | 0.00 | 4 | 0.00 | ||||
| 2025-08-01 | 13F | FSA Advisors, Inc. | 29,829 | -12.08 | 792 | -5.94 | ||||
| 2025-07-25 | 13F | Apollon Financial, LLC | 107,588 | -1.29 | 2,858 | 5.08 | ||||
| 2025-08-08 | 13F | Davies Financial Advisors, Inc. | 32,645 | -0.73 | 867 | 5.73 | ||||
| 2025-08-06 | 13F | Legacy Wealth Managment, LLC/ID | 106,530 | 39.09 | 2,829 | 48.12 | ||||
| 2025-08-14 | 13F | Raymond James Financial Inc | 538,025 | 106.35 | 14,290 | 119.66 | ||||
| 2025-07-28 | 13F | Harbour Investments, Inc. | 526,162 | 6.93 | 13,975 | 13.83 | ||||
| 2025-07-21 | 13F | DHJJ Financial Advisors, Ltd. | 3,645 | -30.83 | 97 | -26.72 | ||||
| 2025-08-12 | 13F | Global Retirement Partners, LLC | 21,499 | 0.00 | 571 | 4.20 | ||||
| 2025-04-22 | 13F | Breakthru Advisory Services, Llc | 0 | -100.00 | 0 | |||||
| 2025-07-29 | 13F | Stratos Wealth Partners, LTD. | 443,723 | -2.55 | 11,785 | 3.74 | ||||
| 2025-07-22 | 13F | Echo Wealth Management, LLC | 54,585 | 10.19 | 1,450 | 17.33 | ||||
| 2025-08-04 | 13F | Creative Financial Designs Inc /adv | 1,435 | 0.00 | 38 | 8.57 | ||||
| 2025-08-14 | 13F | Synovus Financial Corp | 221,781 | 5.49 | 5,891 | 12.30 | ||||
| 2025-07-23 | 13F | Clear Creek Financial Management, LLC | 10,600 | 0.00 | 282 | 6.44 | ||||
| 2025-07-09 | 13F | Pallas Capital Advisors LLC | 22,030 | -62.40 | 585 | -59.96 | ||||
| 2025-08-12 | 13F | SRS Capital Advisors, Inc. | 45,101 | -6.16 | 1,198 | -0.17 | ||||
| 2025-07-16 | 13F | Castleview Partners, Llc | 28,452 | -0.29 | 756 | 6.19 | ||||
| 2025-08-05 | 13F | Sigma Planning Corp | 155,309 | -8.97 | 4,125 | -3.10 | ||||
| 2025-08-11 | 13F | Advisor Resource Council | 10,135 | 5.08 | 269 | 12.08 | ||||
| 2025-07-21 | 13F | Precedent Wealth Partners, Llc | 86,687 | 21.81 | 2,302 | 29.69 | ||||
| 2025-07-22 | 13F | Ergawealth Advisors, Inc. | 56,029 | -12.19 | 1,488 | -6.53 | ||||
| 2025-08-14 | 13F | IHT Wealth Management, LLC | 26,626 | 1.68 | 707 | 8.27 | ||||
| 2025-08-11 | 13F | Private Advisor Group, LLC | 426,708 | 5.96 | 11,333 | 12.80 | ||||
| 2025-08-04 | 13F | Arkadios Wealth Advisors | 52,466 | -1.52 | 1,393 | 4.82 | ||||
| 2025-05-14 | 13F | Ameriprise Financial Inc | 0 | -100.00 | 0 | -100.00 | ||||
| 2025-08-05 | 13F | Atlas Private Wealth Advisors | 207,698 | -25.37 | 5,516 | -20.56 | ||||
| 2025-04-10 | 13F | Whipplewood Advisors, LLC | 0 | -100.00 | 0 | |||||
| 2025-07-17 | 13F | Centennial Wealth Advisory LLC | 1,773,912 | -0.58 | 47,119 | 5.84 | ||||
| 2025-08-14 | 13F | Susquehanna International Group, Llp | 10,868 | -81.31 | 289 | -80.14 | ||||
| 2025-08-14 | 13F | Royal Bank Of Canada | 508,836 | -3.86 | 13,515 | 2.35 | ||||
| 2025-07-09 | 13F | Dynamic Advisor Solutions LLC | 16,761 | -16.99 | 445 | -11.53 | ||||
| 2025-07-17 | 13F | Alliance Wealth Advisors, LLC | 15,469 | 0.00 | 411 | 6.49 | ||||
| 2025-07-17 | 13F | HB Wealth Management, LLC | 8,986 | 0.00 | 239 | 6.25 | ||||
| 2025-08-08 | 13F | Good Life Advisors, LLC | 18,527 | -15.16 | 492 | -9.56 | ||||
| 2025-08-29 | 13F | Centaurus Financial, Inc. | 99,994 | -2.77 | 3 | 0.00 | ||||
| 2025-07-24 | 13F | McKinley Carter Wealth Services, Inc. | 21,637 | 0.00 | 575 | 6.49 | ||||
| 2025-07-15 | 13F | Five Pine Wealth Management | 30,655 | 2.25 | 814 | 8.82 | ||||
| 2025-07-15 | 13F | Legacy Financial Group LLC | 1,933,867 | 0.87 | 51,364 | 7.38 | ||||
| 2025-08-01 | 13F | Envestnet Asset Management Inc | 3,480,049 | 1.32 | 92,430 | 7.86 | ||||
| 2025-08-27 | 13F/A | Brinker Capital Investments, LLC | 31,340 | 10.16 | 832 | 17.35 | ||||
| 2025-07-17 | 13F | Sound Income Strategies, LLC | 633 | 8.21 | 17 | 14.29 | ||||
| 2025-08-18 | 13F | Tyler-Stone Wealth Management | 117,378 | 8.37 | 3,118 | 15.36 |