Statistik Asas
| Pemilik Institusi | 119 total, 119 long only, 0 short only, 0 long/short - change of -3.23% MRQ |
| Purata Peruntukan Portfolio | 0.1128 % - change of 6.84% MRQ |
| Saham Institusi (Panjang) | 5,321,350 (ex 13D/G) - change of 0.20MM shares 3.90% MRQ |
| Nilai Institusi (Panjang) | $ 338,871 USD ($1000) |
Pemilikan Institusi dan Pemegang Saham
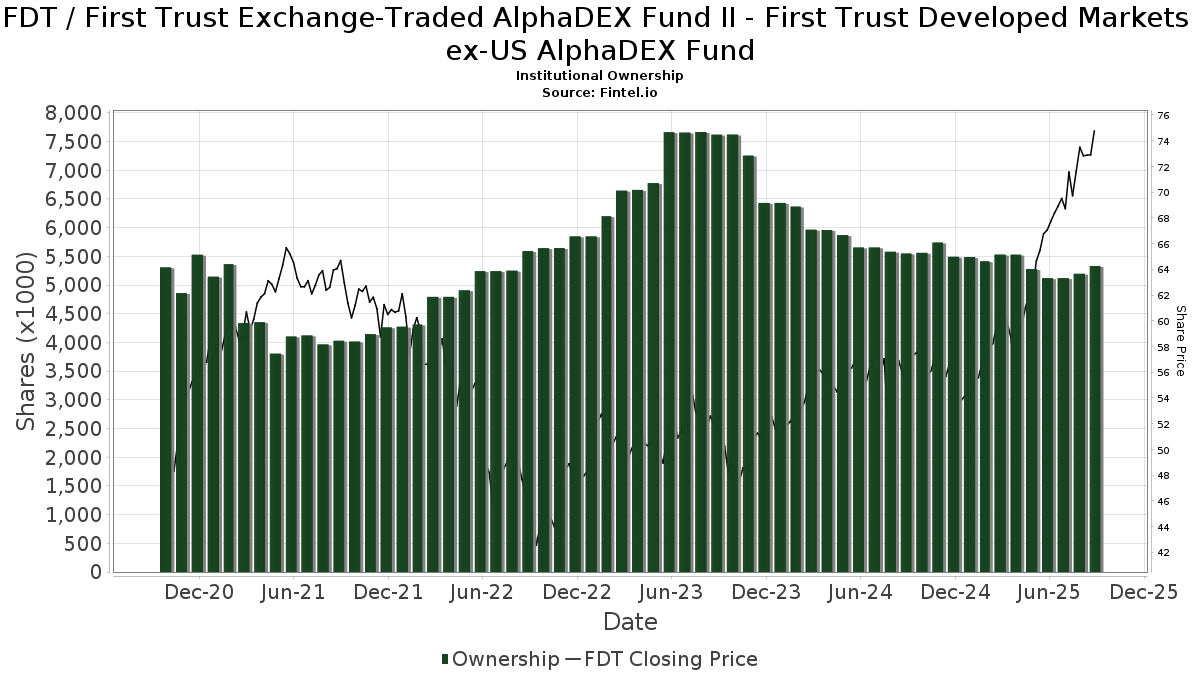
First Trust Exchange-Traded AlphaDEX Fund II - First Trust Developed Markets ex-US AlphaDEX Fund (US:FDT) telah 119 pemilik institusi dan pemegang saham yang telah memfailkan borang 13D/G atau 13F dengan Suruhanjaya Bursa Sekuriti (SEC). Institusi ini memegang sejumlah 5,321,350 saham. Pemegang saham terbesar termasuk Morgan Stanley, LPL Financial LLC, Envestnet Asset Management Inc, Wells Fargo & Company/mn, UBS Group AG, Raymond James Financial Inc, Cambridge Investment Research Advisors, Inc., Royal Bank Of Canada, Cetera Investment Advisers, and Kingsview Wealth Management, LLC .
First Trust Exchange-Traded AlphaDEX Fund II - First Trust Developed Markets ex-US AlphaDEX Fund (NasdaqGM:FDT) struktur pemilikan institusi menunjukkan kedudukan semasa dalam syarikat mengikut institusi dan dana serta perubahan terkini dalam saiz kedudukan. Pemegang saham utama boleh termasuk pelabur individu, dana amanah, dana lindung nilai atau institusi. Jadual 13D menunjukkan bahawa pelabur memegang (atau menahan) lebih daripada 5% syarikat dan berhasrat (atau berniat) untuk secara aktif meneruskan perubahan dalam strategi perniagaan. Jadual 13G menunjukkan pelaburan pasif melebihi 5%.
The share price as of September 3, 2025 is 72.85 / share. Previously, on September 4, 2024, the share price was 55.97 / share. This represents an increase of 30.16% over that period.
Skor Sentimen Dana
Skor Sentimen Dana (Skor Pengumpulan Pemilikan fka) mencari saham yang paling banyak dibeli oleh dana. Ia adalah hasil daripada model kuantitatif pelbagai faktor yang canggih yang mengenal pasti syarikat dengan tahap pengumpulan institusi tertinggi. Model pemarkahan ini menggunakan gabungan jumlah kenaikan dalam pemilik yang didedahkan, perubahan dalam peruntukan portfolio dalam pemilik tersebut dan metrik lain. Nombornya berjulat dari 0 hingga 100, dengan nombor yang lebih tinggi menunjukkan tahap pengumpulan yang lebih tinggi kepada rakannya, dan 50 adalah nombor purata.
Kekerapan Kemas Kini: Harian
Lihat Peneroka Pemilikan yang menyediakan senarai syarikat yang mempunyai kedudukan tertinggi.
Nisbah Put/Call Institusi
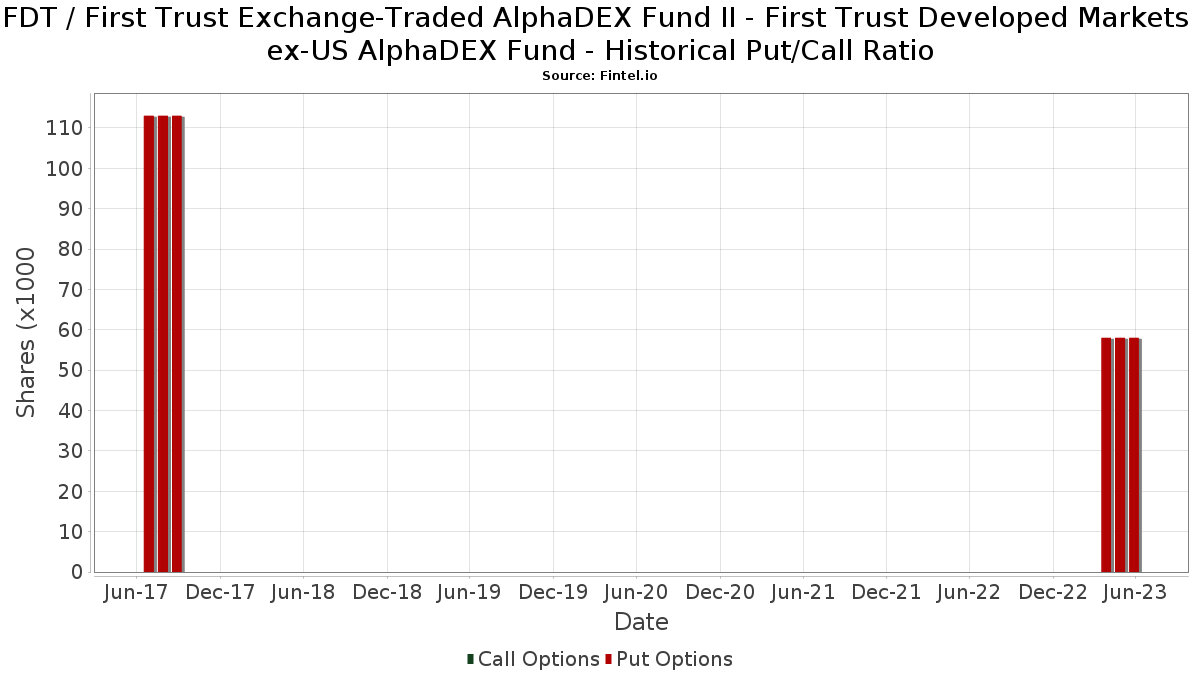
Selain melaporkan isu ekuiti dan hutang standard, institusi yang mempunyai lebih daripada 100MM aset di bawah pengurusan juga mesti mendedahkan pegangan opsyen jual dan beli mereka. Memandangkan opsyen jual secara amnya menunjukkan sentimen negatif, dan opsyen beli menunjukkan sentimen positif, kita boleh mendapatkan gambaran keseluruhan sentimen institusi dengan merencanakan nisbah jual kepada beli. Carta di sebelah kanan memplotkan nisbah jual/beli sejarah untuk instrumen ini.
Menggunakan Nisbah Put/Callsebagai penunjuk sentimen pelabur mengatasi salah satu kekurangan utama menggunakan jumlah pemilikan institusi, iaitu sejumlah besar aset di bawah pengurusan dilaburkan secara pasif untuk menjejaki indeks. Dana yang diurus secara pasif biasanya tidak membeli opsyen, jadi penunjuk nisbah put/call mengekori rapat sentimen dana yang diurus secara aktif.
Pemfailan 13F dan NPORT
Butiran mengenai pemfailan 13F adalah percuma. Perincian mengenai pemfailan NP memerlukan keahlian premium. Baris hijau menunjukkan kedudukan baharu. Baris merah menunjukkan kedudukan tertutup. Klik pautan ikon untuk melihat sejarah transaksi penuh.
Naik Taraf
untuk membuka data premium dan mengeksport ke Excel ![]() .
.
| Tarikh Fail | Sumber | Pelabur | Jenis | Purata Harga (Ang) |
Saham | ΔSaham (%) |
Nilai Dilaporkan ($1000) |
Δ Nilai (%) |
Peruntukan Port (%) |
|
|---|---|---|---|---|---|---|---|---|---|---|
| 2025-05-08 | 13F | Great Valley Advisor Group, Inc. | 0 | -100.00 | 0 | -100.00 | ||||
| 2025-07-21 | 13F | Hilltop National Bank | 1,450 | 0.00 | 100 | 26.92 | ||||
| 2025-05-01 | 13F | Quest 10 Wealth Builders, Inc. | 315 | -5.12 | 18 | 5.88 | ||||
| 2025-08-27 | 13F/A | Brinker Capital Investments, LLC | 25,878 | -10.34 | 1,779 | 5.83 | ||||
| 2025-07-08 | 13F | Nbc Securities, Inc. | 5,991 | -42.10 | 0 | |||||
| 2025-08-08 | 13F | Avantax Advisory Services, Inc. | 41,604 | -9.33 | 2,861 | 7.04 | ||||
| 2025-08-12 | 13F | PSI Advisors, LLC | 0 | -100.00 | 0 | |||||
| 2025-07-09 | 13F | Towerpoint Wealth, LLC | 29,051 | 3.55 | 1,998 | 22.22 | ||||
| 2025-08-05 | 13F | Plante Moran Financial Advisors, LLC | 752 | 0.00 | 52 | 18.60 | ||||
| 2025-04-10 | 13F | TrueWealth Advisors, LLC | 0 | -100.00 | 0 | |||||
| 2025-08-06 | 13F | Golden State Wealth Management, LLC | 2,623 | -24.26 | 180 | -10.45 | ||||
| 2025-08-11 | 13F | Tidemark, LLC | 0 | -100.00 | 0 | |||||
| 2025-08-08 | 13F | L & S Advisors Inc | 32,282 | 15.10 | 2,220 | 35.88 | ||||
| 2025-05-02 | 13F | Capital A Wealth Management, LLC | 0 | -100.00 | 0 | |||||
| 2025-08-14 | 13F | Bank Of America Corp /de/ | 84 | -99.85 | 6 | -99.85 | ||||
| 2025-04-11 | 13F | Davis Capital Management | 93 | 0.00 | 5 | 0.00 | ||||
| 2025-08-29 | 13F | Centaurus Financial, Inc. | 1,738 | 0.00 | 0 | |||||
| 2025-08-11 | 13F | Principal Securities, Inc. | 5,734 | 10.02 | 394 | 40.21 | ||||
| 2025-08-11 | 13F | Citigroup Inc | 246 | 0.00 | 17 | 14.29 | ||||
| 2025-07-29 | 13F | Private Trust Co Na | 0 | -100.00 | 0 | |||||
| 2025-08-14 | 13F | GWM Advisors LLC | 7,339 | 73.58 | 505 | 104.88 | ||||
| 2025-07-24 | 13F | Trust Co Of Toledo Na /oh/ | 210 | 14 | ||||||
| 2025-08-06 | 13F | Commonwealth Equity Services, Llc | 24,537 | 1.60 | 2 | 0.00 | ||||
| 2025-08-12 | 13F | LPL Financial LLC | 628,377 | 18.72 | 43,207 | 40.14 | ||||
| 2025-08-08 | 13F | Kingsview Wealth Management, LLC | 153,279 | -4.39 | 10,539 | 12.86 | ||||
| 2025-08-14 | 13F | Snowden Capital Advisors LLC | 32,135 | 0.02 | 2,210 | 18.07 | ||||
| 2025-08-08 | 13F | Pnc Financial Services Group, Inc. | 0 | -100.00 | 0 | |||||
| 2025-07-14 | 13F | ABLE Financial Group, LLC | 7,253 | -1.57 | 499 | 16.08 | ||||
| 2025-08-04 | 13F | Assetmark, Inc | 149,046 | 13.07 | 10,248 | 33.47 | ||||
| 2025-07-17 | 13F | Janney Montgomery Scott LLC | 31,694 | -3.41 | 2 | 100.00 | ||||
| 2025-08-14 | 13F | Raymond James Financial Inc | 215,203 | -21.19 | 14,797 | -6.97 | ||||
| 2025-05-15 | 13F | Baird Financial Group, Inc. | 0 | -100.00 | 0 | |||||
| 2025-07-24 | 13F | Ronald Blue Trust, Inc. | 17 | 0.00 | 1 | |||||
| 2025-08-15 | 13F | Fsb Premier Wealth Management, Inc. | 25,429 | -17.43 | 1,748 | -2.51 | ||||
| 2025-07-18 | 13F | Truist Financial Corp | 34,311 | -5.40 | 2,359 | 11.70 | ||||
| 2025-08-14 | 13F | Comerica Bank | 21,558 | 42.24 | 1,482 | 68.03 | ||||
| 2025-07-24 | 13F | IFP Advisors, Inc | 41,417 | -2.58 | 2,848 | 14.98 | ||||
| 2025-05-15 | 13F | Integrated Wealth Concepts LLC | 0 | -100.00 | 0 | |||||
| 2025-07-16 | 13F | Formidable Asset Management, LLC | 3,745 | 0.00 | 218 | 0.00 | ||||
| 2025-05-14 | 13F | Caitlin John, LLC | 0 | -100.00 | 0 | |||||
| 2025-07-14 | 13F | GAMMA Investing LLC | 1,731 | -2.92 | 119 | 15.53 | ||||
| 2025-07-21 | 13F | Ameritas Advisory Services, LLC | 261 | 18 | ||||||
| 2025-08-13 | 13F | StoneX Group Inc. | 4,439 | -10.59 | 305 | 5.54 | ||||
| 2025-07-11 | 13F | Pinnacle Bancorp, Inc. | 400 | 0.00 | 28 | 17.39 | ||||
| 2025-07-28 | 13F | BRYN MAWR TRUST Co | 600 | 0.00 | 41 | 20.59 | ||||
| 2025-07-30 | 13F | BlueChip Wealth Advisors LLC | 5,763 | 0.00 | 396 | 18.21 | ||||
| 2025-07-02 | 13F | HBW Advisory Services LLC | 6,658 | -2.45 | 458 | 15.11 | ||||
| 2025-07-11 | 13F | Farther Finance Advisors, LLC | 27,385 | 2,548.45 | 1,883 | 3,038.33 | ||||
| 2025-08-01 | 13F | Rossby Financial, LCC | 1,409 | -0.49 | 97 | 12.94 | ||||
| 2025-08-06 | 13F | Prospera Financial Services Inc | 46,084 | -1.37 | 3,169 | 16.43 | ||||
| 2025-08-01 | 13F | Envestnet Asset Management Inc | 424,243 | -2.08 | 29,171 | 15.58 | ||||
| 2025-08-08 | 13F | 1776 Wealth LLC | 3,148 | 216 | ||||||
| 2025-08-13 | 13F | Jones Financial Companies Lllp | 3,754 | 106.49 | 256 | 141.51 | ||||
| 2025-07-25 | 13F | Atria Wealth Solutions, Inc. | 6,139 | -77.08 | 422 | -72.93 | ||||
| 2025-08-05 | 13F | Bank of New York Mellon Corp | 45,410 | -6.87 | 3,122 | 9.93 | ||||
| 2025-08-04 | 13F | IFG Advisory, LLC | 5,161 | 2.08 | 355 | 20.41 | ||||
| 2025-08-13 | 13F | Transce3nd, LLC | 144 | -11.11 | 10 | 0.00 | ||||
| 2025-08-08 | 13F | Glassman Wealth Services | 0 | -100.00 | 0 | |||||
| 2025-08-19 | 13F | National Asset Management, Inc. | 0 | -100.00 | 0 | |||||
| 2025-05-15 | 13F/A | Orion Portfolio Solutions, LLC | 28,863 | -1.73 | 1,681 | 5.86 | ||||
| 2025-08-18 | 13F | Geneos Wealth Management Inc. | 99 | -6.60 | 7 | 0.00 | ||||
| 2025-08-11 | 13F | NewEdge Wealth, LLC | 23,027 | -7.68 | 1,661 | 14.39 | ||||
| 2025-08-13 | 13F | Colonial Trust Advisors | 200 | 0.00 | 14 | 18.18 | ||||
| 2025-07-28 | 13F | Harbour Investments, Inc. | 8,857 | 6.69 | 609 | 26.09 | ||||
| 2025-08-07 | 13F | Allworth Financial LP | 170 | 12 | ||||||
| 2025-07-15 | 13F | Fifth Third Bancorp | 0 | -100.00 | 0 | |||||
| 2025-08-14 | 13F | Two Sigma Securities, Llc | 0 | -100.00 | 0 | |||||
| 2025-08-14 | 13F | Fmr Llc | 281 | -5.07 | 19 | 11.76 | ||||
| 2025-08-13 | 13F | First Trust Advisors Lp | 12,345 | -3.26 | 849 | 14.13 | ||||
| 2025-08-08 | 13F | Larson Financial Group LLC | 2,256 | -7.84 | 155 | 9.15 | ||||
| 2025-08-11 | 13F | SFI Advisors, LLC | 16,560 | -0.46 | 1,139 | 17.44 | ||||
| 2025-08-08 | 13F | Gts Securities Llc | 0 | -100.00 | 0 | |||||
| 2025-07-15 | 13F | LVZ Advisors, Inc. | 33,250 | -0.95 | 2,286 | 16.93 | ||||
| 2025-07-29 | 13F | Stratos Wealth Partners, LTD. | 10,158 | -2.28 | 698 | 15.37 | ||||
| 2025-08-14 | 13F | Mpwm Advisory Solutions, Llc | 7,095 | 488 | ||||||
| 2025-08-12 | 13F | MAI Capital Management | 220 | 0.00 | 15 | 25.00 | ||||
| 2025-08-26 | NP | FIRST TRUST VARIABLE INSURANCE TRUST - First Trust Dorsey Wright Tactical Core Portfolio Class I This fund is a listed as child fund of First Trust Advisors Lp and if that institution has disclosed ownership in this security, then these positions will not be double counted when calculating total shares and total value | 11,171 | -2.05 | 768 | 15.66 | ||||
| 2025-08-12 | 13F | Global Retirement Partners, LLC | 7,099 | -3.59 | 488 | 22.61 | ||||
| 2025-08-04 | 13F | Atria Investments Llc | 50,108 | -4.67 | 3,445 | 12.54 | ||||
| 2025-08-12 | 13F | Jpmorgan Chase & Co | 588 | 352.31 | 40 | 471.43 | ||||
| 2025-08-13 | 13F | Flow Traders U.s. Llc | 0 | -100.00 | 0 | |||||
| 2025-08-14 | 13F | CoreCap Advisors, LLC | 388 | 0.00 | 27 | 18.18 | ||||
| 2025-07-14 | 13F | Park Avenue Securities Llc | 24,316 | 2 | ||||||
| 2025-07-01 | 13F | Private Client Services, Llc | 4,370 | -1.47 | 300 | 16.28 | ||||
| 2025-08-19 | 13F | Newbridge Financial Services Group, Inc. | 275 | 19 | ||||||
| 2025-08-14 | 13F | Pinnacle Family Advisors, LLC | 8,043 | -2.60 | 553 | 14.97 | ||||
| 2025-05-28 | NP | TFAFX - Tactical Growth Allocation Fund Class I | 483 | 28 | ||||||
| 2025-08-12 | 13F | Steward Partners Investment Advisory, Llc | 138 | 0.00 | 9 | 12.50 | ||||
| 2025-08-05 | 13F | Sigma Planning Corp | 6,096 | 6.82 | 419 | 26.20 | ||||
| 2025-08-13 | 13F | GeoWealth Management, LLC | 2,708 | -0.77 | 186 | 17.72 | ||||
| 2025-08-06 | 13F | AE Wealth Management LLC | 44,616 | -23.06 | 3,068 | -9.18 | ||||
| 2025-07-23 | 13F | Element Wealth, LLC | 4,142 | -0.12 | 285 | 17.84 | ||||
| 2025-08-14 | 13F | Benjamin Edwards Inc | 106,772 | 197.89 | 7,342 | 251.75 | ||||
| 2025-08-14 | 13F | UBS Group AG | 218,467 | -0.51 | 15,022 | 17.44 | ||||
| 2025-07-15 | 13F | Traction Financial Partners, LLC | 7,456 | 513 | ||||||
| 2025-08-11 | 13F | Private Advisor Group, LLC | 13,781 | -22.94 | 948 | -9.03 | ||||
| 2025-07-23 | 13F | REAP Financial Group, LLC | 730 | 1.25 | 50 | 21.95 | ||||
| 2025-08-14 | 13F | Wells Fargo & Company/mn | 283,258 | 38.09 | 19,477 | 63.01 | ||||
| 2025-08-04 | 13F | Spire Wealth Management | 19 | 0.00 | 1 | 0.00 | ||||
| 2025-08-01 | 13F | Brookwood Investment Group LLC | 0 | -100.00 | 0 | |||||
| 2025-08-12 | 13F | Proequities, Inc. | 0 | 0 | ||||||
| 2025-08-14 | 13F | Susquehanna International Group, Llp | 64,000 | 4,401 | ||||||
| 2025-07-16 | 13F | American National Bank | 78 | 0.00 | 5 | 25.00 | ||||
| 2025-07-15 | 13F | FLP Wealth Management, LLC | 0 | -100.00 | 0 | |||||
| 2025-07-24 | 13F | Cyndeo Wealth Partners, LLC | 10,153 | 0.00 | 698 | 18.10 | ||||
| 2025-08-15 | 13F | Morgan Stanley | 1,027,689 | -1.75 | 70,664 | 15.98 | ||||
| 2025-07-14 | 13F | Signature Securities Group Corporation | 11,122 | -3.20 | 765 | 14.20 | ||||
| 2025-07-24 | 13F | Us Bancorp \de\ | 6,928 | 476 | ||||||
| 2025-07-25 | 13F | Cwm, Llc | 40,521 | 111.47 | 3 | 100.00 | ||||
| 2025-08-13 | 13F | Northwestern Mutual Wealth Management Co | 938 | 64 | ||||||
| 2025-08-15 | 13F | Kestra Advisory Services, LLC | 13,788 | 1.64 | 948 | 20.00 | ||||
| 2025-08-05 | 13F | EPG Wealth Management LLC | 0 | -100.00 | 0 | |||||
| 2025-08-12 | 13F | CIBC Private Wealth Group, LLC | 51 | 4 | ||||||
| 2025-08-12 | 13F | OneAscent Financial Services LLC | 27,278 | -0.95 | 2 | 0.00 | ||||
| 2025-08-14 | 13F | Mml Investors Services, Llc | 16,617 | 1.19 | 1 | |||||
| 2025-07-25 | 13F | Envestnet Portfolio Solutions, Inc. | 11,140 | -65.75 | 766 | -59.61 | ||||
| 2025-07-30 | 13F | D.a. Davidson & Co. | 17,863 | -0.33 | 1,228 | 17.74 | ||||
| 2025-07-23 | 13F | TPG Financial Advisors, LLC | 58,659 | 0.66 | 4,033 | 18.83 | ||||
| 2025-07-31 | 13F | Cambridge Investment Research Advisors, Inc. | 204,862 | 81.66 | 14 | 133.33 | ||||
| 2025-07-11 | 13F | SILVER OAK SECURITIES, Inc | 15,661 | 1.27 | 1,077 | 18.63 | ||||
| 2025-08-13 | 13F | Advisor Group Holdings, Inc. | 55,551 | 2.66 | 3,603 | 14.31 | ||||
| 2025-05-16 | 13F/A | Kestra Investment Management, LLC | 0 | -100.00 | 0 | |||||
| 2025-08-04 | 13F | Arkadios Wealth Advisors | 8,486 | -12.29 | 584 | 3.55 | ||||
| 2025-07-25 | 13F | Apollon Wealth Management, LLC | 5,523 | -1.46 | 380 | 16.26 | ||||
| 2025-08-15 | 13F | Captrust Financial Advisors | 9,072 | -21.08 | 624 | -6.88 | ||||
| 2025-08-07 | 13F | PFG Advisors | 9,779 | -39.04 | 672 | -28.05 | ||||
| 2025-08-14 | 13F | Royal Bank Of Canada | 192,379 | -3.65 | 13,227 | 13.72 | ||||
| 2025-07-29 | 13F | Chicago Partners Investment Group LLC | 3,502 | -4.55 | 251 | 10.13 | ||||
| 2025-07-28 | 13F | RFG Advisory, LLC | 6,443 | -0.46 | 443 | 17.51 | ||||
| 2025-08-08 | 13F | Cetera Investment Advisers | 172,136 | -3.34 | 11,836 | 14.10 | ||||
| 2025-08-20 | 13F/A | Coppell Advisory Solutions LLC | 41,054 | -18.41 | 2,803 | -8.96 | ||||
| 2025-08-05 | 13F | Huntington National Bank | 40 | 18.18 | ||||||
| 2025-07-14 | 13F | Iams Wealth Management, Llc | 20,606 | -9.12 | 1,417 | 7.27 | ||||
| 2025-07-21 | 13F | Synergy Financial Management, LLC | 0 | -100.00 | 0 | |||||
| 2025-08-08 | 13F | Creative Planning | 2,969 | 204 | ||||||
| 2025-08-14 | 13F | Jane Street Group, Llc | 0 | -100.00 | 0 | |||||
| 2025-08-14 | 13F | LaSalle St. Investment Advisors, LLC | 7,376 | 2.03 | 1 | |||||
| 2025-08-08 | 13F | Petix & Botte Co | 3,972 | 0.00 | 273 | 18.18 | ||||
| 2025-05-15 | 13F | Mariner, LLC | 0 | -100.00 | 0 | |||||
| 2025-08-12 | 13F | SRS Capital Advisors, Inc. | 240 | 0.00 | 17 | 23.08 | ||||
| 2025-08-13 | 13F | Gateway Wealth Partners, LLC | 29,251 | -15.25 | 2,011 | 0.05 | ||||
| 2025-08-04 | 13F | Waterfront Wealth Inc. | 10,640 | -4.06 | 732 | 13.33 | ||||
| 2025-07-17 | 13F | Mainsail Financial Group, LLC | 80,716 | 0.73 | 5,524 | 18.36 | ||||
| 2025-08-11 | 13F | Synergy Investment Management, LLC | 0 | -100.00 | 0 | |||||
| 2025-08-14 | 13F | Stifel Financial Corp | 100,953 | 181.50 | 6,941 | 232.42 |
Other Listings
| MX:FDT |