Statistik Asas
| Pemilik Institusi | 157 total, 157 long only, 0 short only, 0 long/short - change of -0.63% MRQ |
| Purata Peruntukan Portfolio | 0.3039 % - change of -18.21% MRQ |
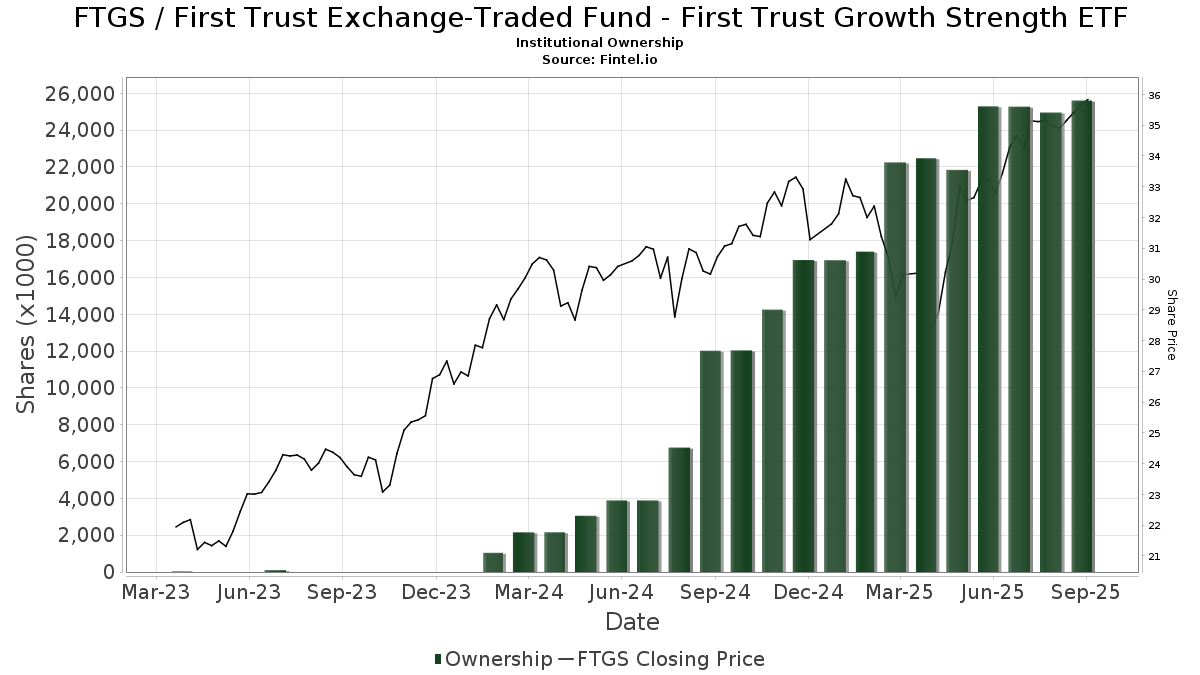
| Saham Institusi (Panjang) | 25,606,205 (ex 13D/G) - change of 0.31MM shares 1.24% MRQ |
| Nilai Institusi (Panjang) | $ 755,138 USD ($1000) |
Pemilikan Institusi dan Pemegang Saham
First Trust Exchange-Traded Fund - First Trust Growth Strength ETF (US:FTGS) telah 157 pemilik institusi dan pemegang saham yang telah memfailkan borang 13D/G atau 13F dengan Suruhanjaya Bursa Sekuriti (SEC). Institusi ini memegang sejumlah 25,606,205 saham. Pemegang saham terbesar termasuk LPL Financial LLC, Cwm, Llc, Envestnet Asset Management Inc, Cetera Investment Advisers, Raymond James Financial Inc, Kestra Advisory Services, LLC, Cambridge Investment Research Advisors, Inc., Commonwealth Equity Services, Llc, Morgan Stanley, and Advisor Group Holdings, Inc. .
First Trust Exchange-Traded Fund - First Trust Growth Strength ETF (NasdaqGM:FTGS) struktur pemilikan institusi menunjukkan kedudukan semasa dalam syarikat mengikut institusi dan dana serta perubahan terkini dalam saiz kedudukan. Pemegang saham utama boleh termasuk pelabur individu, dana amanah, dana lindung nilai atau institusi. Jadual 13D menunjukkan bahawa pelabur memegang (atau menahan) lebih daripada 5% syarikat dan berhasrat (atau berniat) untuk secara aktif meneruskan perubahan dalam strategi perniagaan. Jadual 13G menunjukkan pelaburan pasif melebihi 5%.
The share price as of September 5, 2025 is 35.62 / share. Previously, on September 6, 2024, the share price was 29.56 / share. This represents an increase of 20.50% over that period.
Skor Sentimen Dana
Skor Sentimen Dana (Skor Pengumpulan Pemilikan fka) mencari saham yang paling banyak dibeli oleh dana. Ia adalah hasil daripada model kuantitatif pelbagai faktor yang canggih yang mengenal pasti syarikat dengan tahap pengumpulan institusi tertinggi. Model pemarkahan ini menggunakan gabungan jumlah kenaikan dalam pemilik yang didedahkan, perubahan dalam peruntukan portfolio dalam pemilik tersebut dan metrik lain. Nombornya berjulat dari 0 hingga 100, dengan nombor yang lebih tinggi menunjukkan tahap pengumpulan yang lebih tinggi kepada rakannya, dan 50 adalah nombor purata.
Kekerapan Kemas Kini: Harian
Lihat Peneroka Pemilikan yang menyediakan senarai syarikat yang mempunyai kedudukan tertinggi.
Nisbah Put/Call Institusi
Selain melaporkan isu ekuiti dan hutang standard, institusi yang mempunyai lebih daripada 100MM aset di bawah pengurusan juga mesti mendedahkan pegangan opsyen jual dan beli mereka. Memandangkan opsyen jual secara amnya menunjukkan sentimen negatif, dan opsyen beli menunjukkan sentimen positif, kita boleh mendapatkan gambaran keseluruhan sentimen institusi dengan merencanakan nisbah jual kepada beli. Carta di sebelah kanan memplotkan nisbah jual/beli sejarah untuk instrumen ini.
Menggunakan Nisbah Put/Callsebagai penunjuk sentimen pelabur mengatasi salah satu kekurangan utama menggunakan jumlah pemilikan institusi, iaitu sejumlah besar aset di bawah pengurusan dilaburkan secara pasif untuk menjejaki indeks. Dana yang diurus secara pasif biasanya tidak membeli opsyen, jadi penunjuk nisbah put/call mengekori rapat sentimen dana yang diurus secara aktif.
Pemfailan 13F dan NPORT
Butiran mengenai pemfailan 13F adalah percuma. Perincian mengenai pemfailan NP memerlukan keahlian premium. Baris hijau menunjukkan kedudukan baharu. Baris merah menunjukkan kedudukan tertutup. Klik pautan ikon untuk melihat sejarah transaksi penuh.
Naik Taraf
untuk membuka data premium dan mengeksport ke Excel ![]() .
.
| Tarikh Fail | Sumber | Pelabur | Jenis | Purata Harga (Ang) |
Saham | ΔSaham (%) |
Nilai Dilaporkan ($1000) |
Δ Nilai (%) |
Peruntukan Port (%) |
|
|---|---|---|---|---|---|---|---|---|---|---|
| 2025-07-17 | 13F | Wagner Wealth Management, Llc | 135 | -44.90 | 5 | -42.86 | ||||
| 2025-05-15 | 13F/A | Orion Portfolio Solutions, LLC | 5,436 | -95.20 | 925 | -74.04 | ||||
| 2025-07-16 | 13F | Perigon Wealth Management, LLC | 8,012 | -27.24 | 274 | -16.51 | ||||
| 2025-08-01 | 13F | Rossby Financial, LCC | 2,634 | 0.69 | 90 | 15.38 | ||||
| 2025-07-11 | 13F | Kapstone Financial Advisors LLC | 48,827 | -4.04 | 1,669 | 10.31 | ||||
| 2025-07-15 | 13F | EWG Elevate Inc. | 176,659 | -0.45 | 6,040 | 14.40 | ||||
| 2025-08-14 | 13F | Jane Street Group, Llc | 0 | -100.00 | 0 | |||||
| 2025-08-11 | 13F | Synergy Investment Management, LLC | 0 | -100.00 | 0 | |||||
| 2025-08-14 | 13F | Susquehanna International Group, Llp | 58,099 | 1,986 | ||||||
| 2025-07-01 | 13F | Park National Corp /oh/ | 320,732 | -4.48 | 10,966 | 9.77 | ||||
| 2025-08-14 | 13F | Clg Llc | 62,148 | -14.95 | 2,125 | -2.30 | ||||
| 2025-07-17 | 13F | Barry Investment Advisors, LLC | 17,873 | 0.67 | 611 | 15.72 | ||||
| 2025-08-07 | 13F | Kestra Private Wealth Services, Llc | 180,025 | 5.10 | 6,155 | 20.80 | ||||
| 2025-08-08 | 13F | Kingsview Wealth Management, LLC | 50,715 | -49.64 | 1,734 | -42.16 | ||||
| 2025-08-04 | 13F | Creative Financial Designs Inc /adv | 22,660 | 0.23 | 775 | 15.18 | ||||
| 2025-08-13 | 13F | Transce3nd, LLC | 333 | -21.83 | 11 | -8.33 | ||||
| 2025-08-14 | 13F | Wells Fargo & Company/mn | 52,642 | 2,234.46 | 1,800 | 2,585.07 | ||||
| 2025-07-14 | 13F | Iams Wealth Management, Llc | 115,100 | 0.69 | 3,935 | 15.74 | ||||
| 2025-07-28 | 13F | Harbour Investments, Inc. | 88,749 | 3.03 | 3,034 | 18.42 | ||||
| 2025-08-14 | 13F | Raymond James Financial Inc | 1,189,754 | -0.21 | 40,678 | 14.69 | ||||
| 2025-05-01 | 13F | Quest 10 Wealth Builders, Inc. | 340 | -8.85 | 10 | -9.09 | ||||
| 2025-08-08 | 13F | Cetera Investment Advisers | 1,238,254 | 9.72 | 42,336 | 26.09 | ||||
| 2025-07-09 | 13F | Tounjian Advisory Partners, Llc | 458,528 | -0.94 | 13,641 | -0.94 | ||||
| 2025-08-12 | 13F | Global Retirement Partners, LLC | 20,184 | 9.40 | 690 | 19.17 | ||||
| 2025-08-13 | 13F | Baird Financial Group, Inc. | 173,594 | 2.86 | 5,935 | 18.23 | ||||
| 2025-08-14 | 13F | Goldman Sachs Group Inc | 44,527 | 31.27 | 1,522 | 50.84 | ||||
| 2025-08-18 | 13F | N.E.W. Advisory Services LLC | 1,531 | -99.50 | 52 | -99.43 | ||||
| 2025-07-25 | 13F | Envestnet Portfolio Solutions, Inc. | 27,547 | -65.91 | 942 | -60.84 | ||||
| 2025-07-29 | 13F | International Assets Investment Management, Llc | 22,116 | 5.23 | 756 | 20.96 | ||||
| 2025-07-30 | 13F | D.a. Davidson & Co. | 299,921 | -2.51 | 10,254 | 12.04 | ||||
| 2025-08-07 | 13F | PFG Advisors | 19,152 | -41.46 | 655 | -32.79 | ||||
| 2025-07-23 | 13F | RiverTree Advisors, LLC | 141,617 | -34.08 | 4,842 | -24.25 | ||||
| 2025-07-18 | 13F | Truist Financial Corp | 46,596 | -46.89 | 1,593 | -38.97 | ||||
| 2025-07-14 | 13F | Park Avenue Securities Llc | 60,221 | 2 | ||||||
| 2025-08-11 | 13F | Nations Financial Group Inc, /ia/ /adv | 63,792 | 5.90 | 2,181 | 21.71 | ||||
| 2025-07-23 | 13F | Morey & Quinn Wealth Partners, LLC | 17,934 | 57.40 | 613 | 81.36 | ||||
| 2025-08-07 | 13F | PCG Wealth Advisors, LLC | 0 | -100.00 | 0 | |||||
| 2025-08-14 | 13F | Wiley Bros.-aintree Capital, Llc | 9,698 | 10.29 | 344 | 62.56 | ||||
| 2025-07-15 | 13F | tru Independence LLC | 6,005 | 205 | ||||||
| 2025-08-12 | 13F | CIBC Private Wealth Group, LLC | 407 | 14 | ||||||
| 2025-08-06 | 13F | AE Wealth Management LLC | 117,753 | -32.58 | 4,026 | -22.54 | ||||
| 2025-07-24 | 13F | IFP Advisors, Inc | 117,509 | -8.97 | 4,018 | 4.61 | ||||
| 2025-08-14 | 13F | Stonehaven Wealth & Tax Solutions, Llc | 7,272 | 249 | ||||||
| 2025-07-30 | 13F/A | KPP Advisory Services LLC | 198,514 | 2.43 | 6,787 | 17.73 | ||||
| 2025-07-10 | 13F | Secure Asset Management, LLC | 0 | -100.00 | 0 | |||||
| 2025-04-17 | 13F | American Institute for Advanced Investment Management, LLP | 0 | -100.00 | 0 | -100.00 | ||||
| 2025-07-22 | 13F | DAVENPORT & Co LLC | 6,670 | -1.88 | 228 | 12.87 | ||||
| 2025-08-04 | 13F | Atria Investments Llc | 101,904 | 3.09 | 3,484 | 18.50 | ||||
| 2025-08-06 | 13F | Golden State Wealth Management, LLC | 52,337 | -0.14 | 1,789 | 14.75 | ||||
| 2025-08-12 | 13F | OneAscent Financial Services LLC | 72,960 | -52.42 | 2 | -50.00 | ||||
| 2025-08-13 | 13F | Proactive Wealth Strategies LLC | 60,300 | 0.01 | 2 | 100.00 | ||||
| 2025-07-21 | 13F | Clarity Capital Partners LLC | 9,231 | -18.80 | 316 | -6.80 | ||||
| 2025-07-28 | 13F | RFG Advisory, LLC | 27,105 | 2.59 | 927 | 17.96 | ||||
| 2025-08-11 | 13F | Independent Advisor Alliance | 401,875 | 69.13 | 13,740 | 94.37 | ||||
| 2025-08-14 | 13F | Royal Bank Of Canada | 423,428 | 4.74 | 14,477 | 20.37 | ||||
| 2025-04-21 | 13F | PSI Advisors, LLC | 0 | -100.00 | 0 | |||||
| 2025-07-31 | 13F | West Michigan Advisors, Llc | 153,141 | -3.93 | 5,236 | 10.40 | ||||
| 2025-08-11 | 13F | VSM Wealth Advisory, LLC | 503 | 0.00 | 17 | 21.43 | ||||
| 2025-08-12 | 13F | Steward Partners Investment Advisory, Llc | 47,156 | 10.45 | 1,612 | 26.93 | ||||
| 2025-08-13 | 13F | VestGen Advisors, LLC | 93,359 | 35.10 | 3,192 | 55.28 | ||||
| 2025-08-06 | 13F | Moors & Cabot, Inc. | 60,058 | 6.35 | 2,053 | 22.28 | ||||
| 2025-08-06 | 13F | Prospera Financial Services Inc | 454,762 | -0.43 | 15,549 | 14.43 | ||||
| 2025-07-22 | 13F | Merit Financial Group, LLC | 51,548 | -53.79 | 1,762 | -46.90 | ||||
| 2025-07-30 | 13F | BlueChip Wealth Advisors LLC | 16,192 | 0.00 | 554 | 14.97 | ||||
| 2025-07-25 | 13F | We Are One Seven, LLC | 8,634 | 15.35 | 295 | 32.88 | ||||
| 2025-04-29 | 13F | Onyx Bridge Wealth Group LLC | 0 | -100.00 | 0 | |||||
| 2025-07-15 | 13F | Fifth Third Bancorp | 2,185 | 138.80 | 75 | 174.07 | ||||
| 2025-08-13 | 13F | StoneX Group Inc. | 20,768 | 6.31 | 710 | 22.20 | ||||
| 2025-07-14 | 13F | ABLE Financial Group, LLC | 44,929 | 135.43 | 1,536 | 170.90 | ||||
| 2025-07-10 | 13F | Redhawk Wealth Advisors, Inc. | 10,570 | 5.08 | 361 | 20.74 | ||||
| 2025-07-15 | 13F | BKA Wealth Consulting, Inc. | 0 | -100.00 | 0 | |||||
| 2025-08-13 | 13F | Jones Financial Companies Lllp | 150 | 20.00 | 5 | 66.67 | ||||
| 2025-07-25 | 13F | Atria Wealth Solutions, Inc. | 9,284 | -84.93 | 317 | -82.70 | ||||
| 2025-04-21 | 13F | Nelson, Van Denburg & Campbell Wealth Management Group, LLC | 0 | -100.00 | 0 | |||||
| 2025-09-04 | 13F/A | Advisor Group Holdings, Inc. | 665,133 | 9.38 | 22,663 | 25.28 | ||||
| 2025-04-09 | 13F | St Germain D J Co Inc | 0 | -100.00 | 0 | |||||
| 2025-08-12 | 13F | LPL Financial LLC | 5,043,553 | 15.56 | 172,439 | 32.80 | ||||
| 2025-08-14 | 13F | Integrated Wealth Concepts LLC | 513,859 | 3.36 | 17,569 | 18.78 | ||||
| 2025-08-14 | 13F | Benjamin Edwards Inc | 165,244 | 52.74 | 5,650 | 75.54 | ||||
| 2025-08-12 | 13F | Northeast Planning Associates, Inc. / Nh / | 89,127 | 4.71 | 3,047 | 20.34 | ||||
| 2025-08-11 | 13F | NewEdge Wealth, LLC | 52,199 | -27.48 | 1,808 | -15.55 | ||||
| 2025-08-15 | 13F | Fsb Premier Wealth Management, Inc. | 33,912 | 13.67 | 1,159 | 30.67 | ||||
| 2025-05-15 | 13F | Hilltop Holdings Inc. | 0 | -100.00 | 0 | |||||
| 2025-07-31 | 13F | Hobart Private Capital, LLC | 397,189 | -6.23 | 13,580 | 7.76 | ||||
| 2025-08-08 | 13F | Avantax Advisory Services, Inc. | 196,643 | 14.79 | 6,723 | 31.93 | ||||
| 2025-08-08 | 13F | Foundations Investment Advisors, LLC | 26,218 | -6.87 | 896 | 7.05 | ||||
| 2025-08-14 | 13F | Herold Advisors, Inc. | 13,275 | -33.12 | 454 | -23.22 | ||||
| 2025-08-05 | 13F | EPG Wealth Management LLC | 0 | -100.00 | 0 | |||||
| 2025-08-04 | 13F | IFG Advisory, LLC | 56,006 | 16.33 | 1,915 | 33.66 | ||||
| 2025-08-12 | 13F | Proequities, Inc. | 0 | 0 | ||||||
| 2025-08-14 | 13F | Betterment LLC | 24,040 | 150.91 | 1 | |||||
| 2025-07-02 | 13F | HBW Advisory Services LLC | 20,583 | 5.10 | 704 | 20.79 | ||||
| 2025-07-29 | 13F | Private Trust Co Na | 791 | 29.46 | 27 | 50.00 | ||||
| 2025-07-21 | 13F | Ameritas Advisory Services, LLC | 3,742 | 128 | ||||||
| 2025-08-13 | 13F | Northwestern Mutual Wealth Management Co | 897 | 0.00 | 31 | 15.38 | ||||
| 2025-08-08 | 13F | POM Investment Strategies, LLC | 1 | -100.00 | 0 | -100.00 | ||||
| 2025-08-05 | 13F | Bank of New York Mellon Corp | 117,763 | -6.58 | 4,026 | 7.36 | ||||
| 2025-05-02 | 13F | Capital A Wealth Management, LLC | 0 | -100.00 | 0 | |||||
| 2025-07-11 | 13F | Pinnacle Bancorp, Inc. | 2,086 | 0.00 | 71 | 14.52 | ||||
| 2025-08-06 | 13F | Commonwealth Equity Services, Llc | 849,381 | -12.08 | 29 | 3.57 | ||||
| 2025-08-04 | 13F | Daymark Wealth Partners, Llc | 7,924 | 271 | ||||||
| 2025-07-16 | 13F | ORG Partners LLC | 1,000 | -75.00 | 34 | -71.43 | ||||
| 2025-08-14 | 13F | Great Valley Advisor Group, Inc. | 28,272 | -23.47 | 967 | -12.10 | ||||
| 2025-04-30 | 13F | Allworth Financial LP | 0 | -100.00 | 0 | |||||
| 2025-08-11 | 13F | Private Advisor Group, LLC | 336,920 | 0.35 | 11,519 | 15.33 | ||||
| 2025-07-31 | 13F | Oppenheimer & Co Inc | 10,150 | 347 | ||||||
| 2025-08-14 | 13F | Mariner, LLC | 8,150 | -40.18 | 279 | -31.36 | ||||
| 2025-07-22 | 13F | Comprehensive Financial Consultants Institutional, Inc. | 46,920 | -1.47 | 1,604 | 13.28 | ||||
| 2025-08-11 | 13F/A | Purus Wealth Management, LLC | 14,417 | -1.83 | 493 | 12.84 | ||||
| 2025-04-07 | 13F | GAMMA Investing LLC | 0 | -100.00 | 0 | |||||
| 2025-05-16 | 13F/A | Kestra Investment Management, LLC | 0 | -100.00 | 0 | |||||
| 2025-08-15 | 13F | Kestra Advisory Services, LLC | 1,007,030 | 50.95 | 34,430 | 73.48 | ||||
| 2025-08-05 | 13F | Sigma Planning Corp | 117,320 | -40.75 | 4,011 | -31.91 | ||||
| 2025-08-11 | 13F | Aptus Capital Advisors, LLC | 0 | -100.00 | 0 | |||||
| 2025-04-17 | 13F | Janney Montgomery Scott LLC | 0 | -100.00 | 0 | |||||
| 2025-08-05 | 13F | GPS Wealth Strategies Group, LLC | 11,134 | 588.13 | 381 | 691.67 | ||||
| 2025-08-14 | 13F | LaSalle St. Investment Advisors, LLC | 11,445 | 44.13 | 0 | |||||
| 2025-07-15 | 13F | FLP Wealth Management, LLC | 0 | -100.00 | 0 | |||||
| 2025-07-24 | 13F | Us Bancorp \de\ | 680 | 23 | ||||||
| 2025-07-17 | 13F | Albion Financial Group /ut | 5,735 | 0.00 | 196 | 15.29 | ||||
| 2025-07-15 | 13F | LVZ Advisors, Inc. | 106,729 | -0.35 | 3,649 | 14.53 | ||||
| 2025-08-12 | 13F | J.w. Cole Advisors, Inc. | 10,359 | 6.31 | 354 | 22.49 | ||||
| 2025-07-01 | 13F | Private Client Services, Llc | 14,638 | -6.88 | 500 | 7.07 | ||||
| 2025-07-24 | 13F | Costello Asset Management, INC | 0 | -100.00 | 0 | |||||
| 2025-07-11 | 13F | Farther Finance Advisors, LLC | 35,159 | -13.09 | 1,202 | -0.41 | ||||
| 2025-08-04 | 13F | Arkadios Wealth Advisors | 12,574 | 10.55 | 430 | 26.92 | ||||
| 2025-08-05 | 13F | BEAM Asset Management, LLC | 13,809 | 472 | ||||||
| 2025-08-13 | 13F | Gateway Wealth Partners, LLC | 82,263 | -30.85 | 2,813 | -20.54 | ||||
| 2025-07-22 | 13F | Belpointe Asset Management LLC | 49,525 | -29.48 | 1,693 | -18.96 | ||||
| 2025-08-14 | 13F | CoreCap Advisors, LLC | 67,568 | -12.88 | 2,310 | 0.13 | ||||
| 2025-08-13 | 13F | Smith, Moore & Co. | 7,627 | 261 | ||||||
| 2025-05-15 | 13F | Harvest Investment Services, LLC | 0 | -100.00 | 0 | |||||
| 2025-08-04 | 13F | Assetmark, Inc | 408,466 | 13.39 | 13,965 | 30.31 | ||||
| 2025-08-01 | 13F | Envestnet Asset Management Inc | 1,249,526 | 1.70 | 42,721 | 16.88 | ||||
| 2025-07-29 | 13F | Altus Wealth Group LLC | 42,504 | -1.80 | 1,453 | 12.90 | ||||
| 2025-08-13 | 13F | Flow Traders U.s. Llc | 0 | -100.00 | 0 | |||||
| 2025-07-16 | 13F | American National Bank | 363 | 0.00 | 12 | 20.00 | ||||
| 2025-07-24 | 13F | Ronald Blue Trust, Inc. | 86 | 0.00 | 3 | 0.00 | ||||
| 2025-08-13 | 13F | GeoWealth Management, LLC | 11,254 | 10.31 | 385 | 26.73 | ||||
| 2025-08-14 | 13F | Fmr Llc | 605 | -66.05 | 21 | -62.26 | ||||
| 2025-08-01 | 13F | Wealth Watch Advisors, INC | 25,457 | 13.18 | 870 | 30.04 | ||||
| 2025-07-29 | 13F | ODonnell Financial Services, LLC | 489,668 | 0.73 | 16,742 | 15.77 | ||||
| 2025-08-14 | 13F | Pinnacle Family Advisors, LLC | 55,387 | -16.24 | 1,894 | -3.76 | ||||
| 2025-07-21 | 13F | DHJJ Financial Advisors, Ltd. | 23,638 | 0.70 | 808 | 15.76 | ||||
| 2025-07-15 | 13F | Traction Financial Partners, LLC | 25,645 | 877 | ||||||
| 2025-08-13 | 13F | Maia Wealth LLC | 48,798 | -6.12 | 1,668 | 11.27 | ||||
| 2025-08-18 | 13F | Geneos Wealth Management Inc. | 20,782 | 113.35 | 711 | 145.67 | ||||
| 2025-08-11 | 13F | Mach-1 Financial Group, Inc. | 495,620 | 9.35 | 16,945 | 25.67 | ||||
| 2025-07-29 | 13F | Stratos Wealth Partners, LTD. | 14,367 | 82.79 | 491 | 110.73 | ||||
| 2025-08-04 | 13F | Impact Partnership Wealth, LLC | 12,064 | -22.99 | 412 | -11.59 | ||||
| 2025-08-06 | 13F | Legacy Wealth Managment, LLC/ID | 41,600 | 28.86 | 1,422 | 48.13 | ||||
| 2025-08-15 | 13F | Equitable Holdings, Inc. | 42,656 | 336.69 | 1,458 | 402.76 | ||||
| 2025-08-11 | 13F | Principal Securities, Inc. | 11,265 | -7.15 | 385 | 1.32 | ||||
| 2025-08-15 | 13F | Morgan Stanley | 676,790 | 8.14 | 23,139 | 24.28 | ||||
| 2025-08-14 | 13F | Synovus Financial Corp | 59,982 | -13.78 | 2,051 | -0.87 | ||||
| 2025-08-20 | 13F/A | Coppell Advisory Solutions LLC | 48,046 | -49.40 | 1,630 | -43.40 | ||||
| 2025-07-11 | 13F | SILVER OAK SECURITIES, Inc | 9,806 | -9.25 | 335 | 5.02 | ||||
| 2025-08-06 | 13F | Legacy Investment Solutions, LLC | 41,600 | 39.14 | 1,422 | 46.45 | ||||
| 2025-08-14 | 13F | Citadel Advisors Llc | 62,168 | -26.87 | 2,126 | -15.94 | ||||
| 2025-07-23 | 13F | REAP Financial Group, LLC | 2,833 | 0.00 | 97 | 14.29 | ||||
| 2025-08-14 | 13F | GWM Advisors LLC | 193,833 | 0.90 | 6,627 | 15.98 | ||||
| 2025-08-14 | 13F | UBS Group AG | 0 | -100.00 | 0 | |||||
| 2025-07-08 | 13F | Parallel Advisors, LLC | 25 | 1 | ||||||
| 2025-08-12 | 13F | SRS Capital Advisors, Inc. | 2,538 | -59.42 | 87 | -53.76 | ||||
| 2025-08-14 | 13F | Snowden Capital Advisors LLC | 140,413 | -3.35 | 4,801 | 11.06 | ||||
| 2025-08-06 | 13F | RFG - Bristol Wealth Advisors, LLC | 39,063 | 24.70 | 1,336 | 43.39 | ||||
| 2025-08-14 | 13F | Bank Of America Corp /de/ | 1,433 | -26.85 | 49 | -17.24 | ||||
| 2025-08-14 | 13F | Stifel Financial Corp | 554,413 | 18.27 | 18,957 | 35.93 | ||||
| 2025-07-17 | 13F | Centennial Wealth Advisory LLC | 72,133 | 70.67 | 2,466 | 96.18 | ||||
| 2025-05-01 | 13F | Stephens Inc /ar/ | 0 | -100.00 | 0 | |||||
| 2025-07-22 | 13F | Ergawealth Advisors, Inc. | 21,893 | 14.77 | 749 | 31.92 | ||||
| 2025-05-13 | 13F | O'shaughnessy Asset Management, Llc | 0 | -100.00 | 0 | |||||
| 2025-07-08 | 13F | Nbc Securities, Inc. | 3,057 | 0.00 | 0 | |||||
| 2025-08-04 | 13F | Integrity Alliance, Llc. | 0 | -100.00 | 0 | |||||
| 2025-07-25 | 13F | Cwm, Llc | 1,288,291 | 3.56 | 44 | 18.92 | ||||
| 2025-08-11 | 13F | WPG Advisers, LLC | 13,642 | 23.03 | 466 | 41.64 | ||||
| 2025-08-08 | 13F | Petix & Botte Co | 8,250 | 282 | ||||||
| 2025-08-27 | 13F/A | Brinker Capital Investments, LLC | 80,353 | 1,378.16 | 2,747 | 197.29 | ||||
| 2025-07-17 | 13F | San Luis Wealth Advisors LLC | 0 | -100.00 | 0 | |||||
| 2025-07-25 | 13F | Apollon Wealth Management, LLC | 14,882 | -21.24 | 509 | -9.61 | ||||
| 2025-07-21 | 13F | Ameriflex Group, Inc. | 496 | 0.00 | 17 | 14.29 | ||||
| 2025-07-31 | 13F | Cambridge Investment Research Advisors, Inc. | 958,178 | 22.54 | 33 | 39.13 | ||||
| 2025-08-14 | 13F | Mml Investors Services, Llc | 153,702 | -18.04 | 5 | 0.00 | ||||
| 2025-08-11 | 13F | Western Wealth Management, LLC | 29,235 | -5.52 | 1,000 | 8.59 | ||||
| 2025-08-06 | 13F | New Millennium Group LLC | 0 | 0 | ||||||
| 2025-08-08 | 13F | Good Life Advisors, LLC | 207,815 | 10.71 | 7,105 | 27.24 |
Other Listings
| MX:FTGS |