Statistik Asas
| Pemilik Institusi | 168 total, 168 long only, 0 short only, 0 long/short - change of -10.11% MRQ |
| Purata Peruntukan Portfolio | 0.1253 % - change of -17.80% MRQ |
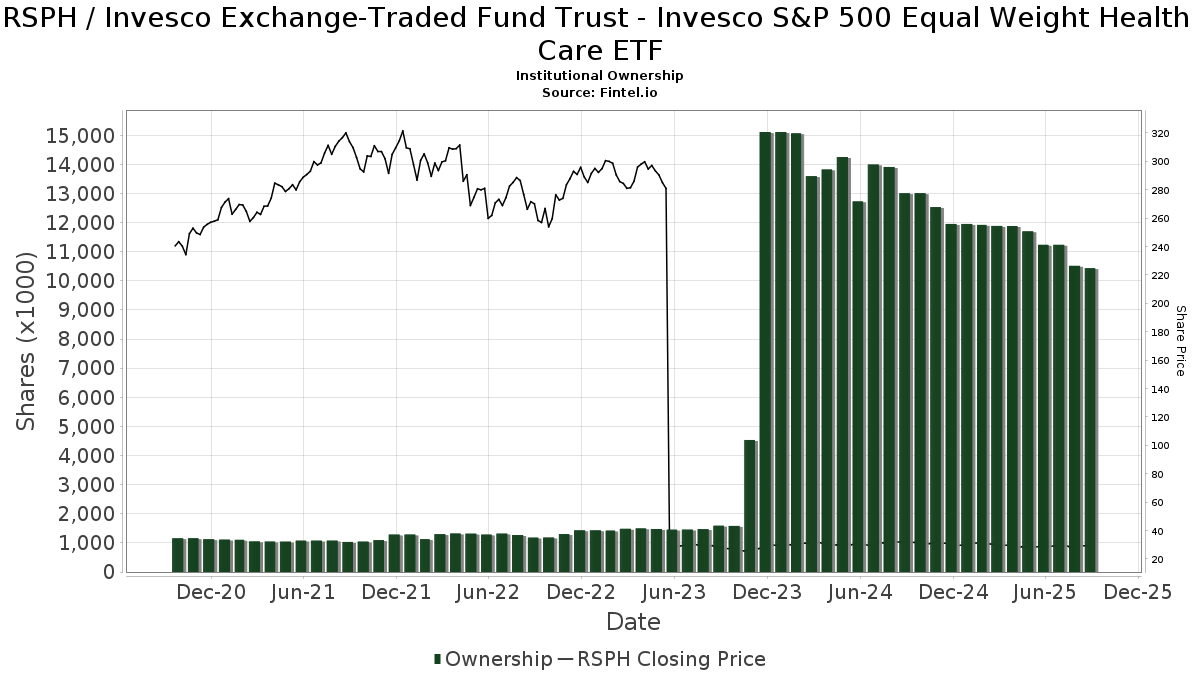
| Saham Institusi (Panjang) | 10,435,096 (ex 13D/G) - change of -0.77MM shares -6.89% MRQ |
| Nilai Institusi (Panjang) | $ 297,531 USD ($1000) |
Pemilikan Institusi dan Pemegang Saham
Invesco Exchange-Traded Fund Trust - Invesco S&P 500 Equal Weight Health Care ETF (US:RSPH) telah 168 pemilik institusi dan pemegang saham yang telah memfailkan borang 13D/G atau 13F dengan Suruhanjaya Bursa Sekuriti (SEC). Institusi ini memegang sejumlah 10,435,096 saham. Pemegang saham terbesar termasuk HighTower Advisors, LLC, Morgan Stanley, LPL Financial LLC, Walled Lake Planning & Wealth Management, Llc, Bank Of America Corp /de/, Royal Bank Of Canada, Raymond James Financial Inc, MAI Capital Management, Jpmorgan Chase & Co, and Federation des caisses Desjardins du Quebec .
Invesco Exchange-Traded Fund Trust - Invesco S&P 500 Equal Weight Health Care ETF (ARCA:RSPH) struktur pemilikan institusi menunjukkan kedudukan semasa dalam syarikat mengikut institusi dan dana serta perubahan terkini dalam saiz kedudukan. Pemegang saham utama boleh termasuk pelabur individu, dana amanah, dana lindung nilai atau institusi. Jadual 13D menunjukkan bahawa pelabur memegang (atau menahan) lebih daripada 5% syarikat dan berhasrat (atau berniat) untuk secara aktif meneruskan perubahan dalam strategi perniagaan. Jadual 13G menunjukkan pelaburan pasif melebihi 5%.
The share price as of September 8, 2025 is 29.49 / share. Previously, on September 9, 2024, the share price was 31.79 / share. This represents a decline of 7.23% over that period.
Skor Sentimen Dana
Skor Sentimen Dana (Skor Pengumpulan Pemilikan fka) mencari saham yang paling banyak dibeli oleh dana. Ia adalah hasil daripada model kuantitatif pelbagai faktor yang canggih yang mengenal pasti syarikat dengan tahap pengumpulan institusi tertinggi. Model pemarkahan ini menggunakan gabungan jumlah kenaikan dalam pemilik yang didedahkan, perubahan dalam peruntukan portfolio dalam pemilik tersebut dan metrik lain. Nombornya berjulat dari 0 hingga 100, dengan nombor yang lebih tinggi menunjukkan tahap pengumpulan yang lebih tinggi kepada rakannya, dan 50 adalah nombor purata.
Kekerapan Kemas Kini: Harian
Lihat Peneroka Pemilikan yang menyediakan senarai syarikat yang mempunyai kedudukan tertinggi.
Nisbah Put/Call Institusi
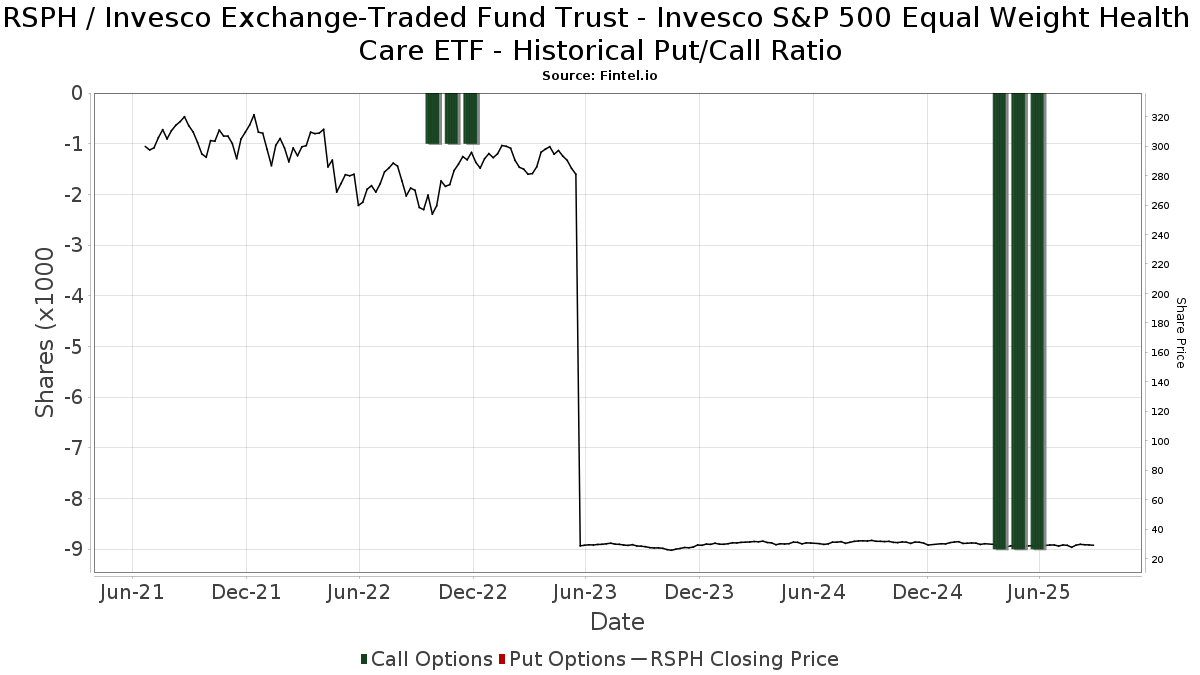
Selain melaporkan isu ekuiti dan hutang standard, institusi yang mempunyai lebih daripada 100MM aset di bawah pengurusan juga mesti mendedahkan pegangan opsyen jual dan beli mereka. Memandangkan opsyen jual secara amnya menunjukkan sentimen negatif, dan opsyen beli menunjukkan sentimen positif, kita boleh mendapatkan gambaran keseluruhan sentimen institusi dengan merencanakan nisbah jual kepada beli. Carta di sebelah kanan memplotkan nisbah jual/beli sejarah untuk instrumen ini.
Menggunakan Nisbah Put/Callsebagai penunjuk sentimen pelabur mengatasi salah satu kekurangan utama menggunakan jumlah pemilikan institusi, iaitu sejumlah besar aset di bawah pengurusan dilaburkan secara pasif untuk menjejaki indeks. Dana yang diurus secara pasif biasanya tidak membeli opsyen, jadi penunjuk nisbah put/call mengekori rapat sentimen dana yang diurus secara aktif.
Pemfailan 13F dan NPORT
Butiran mengenai pemfailan 13F adalah percuma. Perincian mengenai pemfailan NP memerlukan keahlian premium. Baris hijau menunjukkan kedudukan baharu. Baris merah menunjukkan kedudukan tertutup. Klik pautan ikon untuk melihat sejarah transaksi penuh.
Naik Taraf
untuk membuka data premium dan mengeksport ke Excel ![]() .
.
| Tarikh Fail | Sumber | Pelabur | Jenis | Purata Harga (Ang) |
Saham | ΔSaham (%) |
Nilai Dilaporkan ($1000) |
Δ Nilai (%) |
Peruntukan Port (%) |
|
|---|---|---|---|---|---|---|---|---|---|---|
| 2025-08-11 | 13F | HighTower Advisors, LLC | 2,246,103 | -7.13 | 65,541 | -8.91 | ||||
| 2025-07-23 | 13F | Country Club Bank /gfn | 7,500 | 0.00 | 218 | -1.81 | ||||
| 2025-08-14 | 13F | Boston Private Wealth Llc | 0 | -100.00 | 0 | |||||
| 2025-07-14 | 13F | CRA Financial Services, LLC | 17,106 | -8.65 | 499 | -10.41 | ||||
| 2025-08-11 | 13F | Aptus Capital Advisors, LLC | 104 | -38.46 | 3 | -40.00 | ||||
| 2025-05-15 | 13F | Hrt Financial Lp | 0 | -100.00 | 0 | |||||
| 2025-08-12 | 13F | Fca Corp /tx | 139,979 | 2.51 | 4,085 | 0.54 | ||||
| 2025-07-23 | 13F | Optas, LLC | 30,398 | -3.10 | 887 | -4.93 | ||||
| 2025-08-12 | 13F | Franklin Resources Inc | 900 | 0.00 | 26 | 0.00 | ||||
| 2025-08-12 | 13F | LPL Financial LLC | 450,503 | -2.93 | 13,146 | -4.79 | ||||
| 2025-08-14 | 13F | Comerica Bank | 2,100 | -39.85 | 61 | -40.78 | ||||
| 2025-07-10 | 13F | Exchange Traded Concepts, Llc | 1,001 | 29 | ||||||
| 2025-07-24 | 13F | Blair William & Co/il | 7,000 | 0.00 | 204 | -1.92 | ||||
| 2025-05-15 | 13F | Graham Capital Management, L.P. | 0 | -100.00 | 0 | |||||
| 2025-07-14 | 13F | AdvisorNet Financial, Inc | 3,660 | 0.00 | 107 | -1.85 | ||||
| 2025-08-12 | 13F | Financial Advocates Investment Management | 0 | -100.00 | 0 | -100.00 | ||||
| 2025-08-14 | 13F | Guardian Wealth Management, Inc. | 0 | -100.00 | 0 | |||||
| 2025-08-12 | 13F | Global Retirement Partners, LLC | 163 | 0.62 | 5 | 0.00 | ||||
| 2025-08-12 | 13F | O'shaughnessy Asset Management, Llc | 1,037 | 0.19 | 30 | 0.00 | ||||
| 2025-08-14 | 13F | Ausdal Financial Partners, Inc. | 59,345 | -3.14 | 1,732 | -4.99 | ||||
| 2025-08-12 | 13F | Stelac Advisory Services LLC | 70,061 | -1.49 | 2,045 | -3.31 | ||||
| 2025-07-22 | 13F | Valley National Advisers Inc | 3,020 | 0.00 | 0 | |||||
| 2025-08-14 | 13F | EP Wealth Advisors, Inc. | 6,400 | 15.94 | 187 | 13.41 | ||||
| 2025-08-04 | 13F | Crescent Sterling, Ltd. | 0 | -100.00 | 0 | |||||
| 2025-08-12 | 13F | MAI Capital Management | 329,368 | -1.99 | 9,611 | -3.87 | ||||
| 2025-08-14 | 13F | Wiley Bros.-aintree Capital, Llc | 26,357 | 0.73 | 769 | -0.52 | ||||
| 2025-08-15 | 13F | Equitable Holdings, Inc. | 8,550 | -29.80 | 249 | -31.22 | ||||
| 2025-05-09 | 13F | Comprehensive Financial Planning, Inc./PA | 0 | -100.00 | 0 | |||||
| 2025-08-13 | 13F | Beacon Pointe Advisors, LLC | 30,050 | 0.00 | 877 | -1.90 | ||||
| 2025-07-11 | 13F | SILVER OAK SECURITIES, Inc | 354 | 10 | ||||||
| 2025-07-31 | 13F | Hartford Financial Management Inc. | 62,366 | -3.36 | 1,820 | -5.21 | ||||
| 2025-08-08 | 13F | Hartland & Co., LLC | 17,945 | -38.86 | 524 | -40.09 | ||||
| 2025-08-14 | 13F | Fmr Llc | 17,112 | -21.40 | 499 | -22.87 | ||||
| 2025-08-11 | 13F | Citigroup Inc | 1,936 | 56 | ||||||
| 2025-08-12 | 13F | Walled Lake Planning & Wealth Management, Llc | 407,726 | 5.29 | 11,897 | 3.27 | ||||
| 2025-08-06 | 13F | Legacy Bridge, LLC | 5,210 | 0.00 | 152 | -1.30 | ||||
| 2025-08-07 | 13F | Runnymede Capital Advisors, Inc. | 0 | -100.00 | 0 | |||||
| 2025-07-15 | 13F | North Star Investment Management Corp. | 0 | -100.00 | 0 | |||||
| 2025-04-30 | 13F | Sofos Investments, Inc. | 266 | 322.22 | 8 | 600.00 | ||||
| 2025-08-12 | 13F | Atlas Capital Advisors Llc | 14,567 | 0.01 | 425 | -1.85 | ||||
| 2025-04-29 | 13F | Lee Danner & Bass Inc | 0 | -100.00 | 0 | |||||
| 2025-08-13 | 13F | Gateway Wealth Partners, LLC | 7,529 | 0.03 | 220 | -1.79 | ||||
| 2025-08-18 | 13F | Hollencrest Capital Management | 1,420 | 0.00 | 41 | -2.38 | ||||
| 2025-08-12 | 13F | Proequities, Inc. | 0 | 0 | ||||||
| 2025-07-24 | 13F | IFP Advisors, Inc | 3,250 | 0.00 | 95 | -2.08 | ||||
| 2025-08-05 | 13F | Wakefield Asset Management LLLP | 0 | -100.00 | 0 | |||||
| 2025-07-18 | 13F | Cooper Financial Group | 11,492 | 0.00 | 335 | -1.76 | ||||
| 2025-07-29 | 13F | Empirical Asset Management, LLC | 29,780 | -3.56 | 869 | -5.45 | ||||
| 2025-07-22 | 13F | Yoder Wealth Management, Inc. | 66,595 | 9.83 | 1,943 | 7.76 | ||||
| 2025-08-14 | 13F | Bank Of America Corp /de/ | 401,689 | -11.13 | 11,721 | -12.84 | ||||
| 2025-07-21 | 13F | Kennebec Savings Bank | 0 | -100.00 | 0 | |||||
| 2025-08-18 | 13F/A | National Bank Of Canada /fi/ | 5,295 | 0.00 | 155 | -1.91 | ||||
| 2025-08-13 | 13F | Northwestern Mutual Wealth Management Co | 5,032 | -4.46 | 147 | -6.41 | ||||
| 2025-08-11 | 13F | Principal Securities, Inc. | 13,998 | -2.96 | 408 | -3.32 | ||||
| 2025-08-13 | 13F | Continuum Advisory, LLC | 0 | -100.00 | 0 | |||||
| 2025-08-14 | 13F | Quantinno Capital Management LP | 15,200 | -4.81 | 444 | -6.74 | ||||
| 2025-08-08 | 13F | Cetera Investment Advisers | 110,709 | 12.18 | 3,230 | 10.05 | ||||
| 2025-08-13 | 13F | Cerity Partners LLC | 9,124 | -0.86 | 266 | -2.56 | ||||
| 2025-08-14 | 13F | Federation des caisses Desjardins du Quebec | 295,294 | 7.46 | 8,617 | 5.39 | ||||
| 2025-08-08 | 13F | Avalon Trust Co | 1,000 | 0.00 | 29 | 0.00 | ||||
| 2025-08-15 | 13F | First Heartland Consultants, Inc. | 25,025 | -2.82 | 730 | -4.70 | ||||
| 2025-05-15 | 13F | TFG Advisers LLC | 0 | -100.00 | 0 | |||||
| 2025-04-29 | 13F | Financial Network Wealth Management LLC | 840 | 0 | ||||||
| 2025-07-11 | 13F | Farther Finance Advisors, LLC | 123,776 | 1.71 | 3,612 | 0.98 | ||||
| 2025-08-14 | 13F | Susquehanna International Group, Llp | 20,052 | 50.63 | 585 | 47.73 | ||||
| 2025-07-15 | 13F | McAdam, LLC | 57,520 | -4.06 | 1,678 | -5.89 | ||||
| 2025-07-24 | 13F | Live Oak Investment Partners | 8,241 | 0.00 | 240 | -2.04 | ||||
| 2025-08-13 | 13F | Lido Advisors, LLC | 32,002 | -4.41 | 934 | -6.33 | ||||
| 2025-07-28 | 13F | Pettinga Financial Advisors, LLC | 53,129 | 88.17 | 1,550 | 84.74 | ||||
| 2025-08-12 | 13F | CIBC Private Wealth Group, LLC | 713 | 0.00 | 21 | 5.26 | ||||
| 2025-07-08 | 13F | Nbc Securities, Inc. | 500 | 0.00 | 0 | |||||
| 2025-04-23 | 13F | Sylvest Advisors, LLC | 0 | -100.00 | 0 | |||||
| 2025-08-11 | 13F | Rothschild Investment Llc | 700 | 0.00 | 20 | 0.00 | ||||
| 2025-08-11 | 13F | Pin Oak Investment Advisors Inc | 500 | 0.00 | 0 | |||||
| 2025-08-08 | 13F | Atlantic Trust, LLC | 1,250 | 0.00 | 36 | -2.70 | ||||
| 2025-07-25 | 13F | Envestnet Portfolio Solutions, Inc. | 0 | -100.00 | 0 | |||||
| 2025-08-01 | 13F | Envestnet Asset Management Inc | 41,637 | 6.89 | 1,215 | 4.84 | ||||
| 2025-05-08 | 13F | Empirical Financial Services, LLC d.b.a. Empirical Wealth Management | 0 | -100.00 | 0 | |||||
| 2025-08-12 | 13F | Jpmorgan Chase & Co | 327,886 | 98.99 | 9,568 | 95.17 | ||||
| 2025-08-04 | 13F | Kovack Advisors, Inc. | 17,954 | -2.02 | 524 | -4.04 | ||||
| 2025-07-29 | 13F | Private Trust Co Na | 5,183 | -70.13 | 151 | -70.74 | ||||
| 2025-07-18 | 13F | Truist Financial Corp | 0 | -100.00 | 0 | |||||
| 2025-08-06 | 13F | AE Wealth Management LLC | 977 | 3.83 | 29 | 3.70 | ||||
| 2025-07-21 | 13F | DHJJ Financial Advisors, Ltd. | 14,816 | 0.01 | 432 | -1.82 | ||||
| 2025-07-31 | 13F | Blue Sky Capital Consultants Group, Inc. | 25,725 | -5.36 | 751 | -7.18 | ||||
| 2025-07-10 | 13F | Focus Financial Network, Inc. | 122,087 | 2.15 | 3,562 | 0.20 | ||||
| 2025-08-13 | 13F | Jones Financial Companies Lllp | 43,100 | 25.13 | 1,252 | 22.99 | ||||
| 2025-08-15 | 13F | Kestra Advisory Services, LLC | 13,786 | -9.36 | 402 | -11.06 | ||||
| 2025-08-15 | 13F | CI Private Wealth, LLC | 23,743 | 0.06 | 693 | -1.84 | ||||
| 2025-08-08 | 13F | Avantax Advisory Services, Inc. | 12,508 | 8.93 | 365 | 6.74 | ||||
| 2025-07-15 | 13F | Mather Group, Llc. | 0 | -100.00 | 0 | |||||
| 2025-08-13 | 13F | Measured Wealth Private Client Group, LLC | 0 | -100.00 | 0 | |||||
| 2025-05-14 | 13F | Jane Street Group, Llc | 0 | -100.00 | 0 | |||||
| 2025-05-15 | 13F | Two Sigma Investments, Lp | 0 | -100.00 | 0 | |||||
| 2025-05-15 | 13F | Blue Chip Partners, Inc. | 0 | -100.00 | 0 | -100.00 | ||||
| 2025-08-28 | 13F/A | Lavaca Capital Llc | 1,100 | 0.00 | 32 | 0.00 | ||||
| 2025-08-01 | 13F | Belvedere Trading LLC | Call | 9,100 | 266 | |||||
| 2025-07-30 | 13F | Cornerstone Advisory, LLC | 78,813 | -1.12 | 2,300 | 3.23 | ||||
| 2025-08-19 | 13F | Asset Dedication, LLC | 17,685 | 0.00 | 516 | -1.90 | ||||
| 2025-07-29 | 13F | Koshinski Asset Management, Inc. | 12,705 | 0.01 | 371 | -1.86 | ||||
| 2025-08-12 | 13F | Howe & Rusling Inc | 125 | 0.00 | 4 | 0.00 | ||||
| 2025-08-13 | 13F | Rsm Us Wealth Management Llc | 22,780 | 0.00 | 665 | -1.92 | ||||
| 2025-08-14 | 13F | Great Valley Advisor Group, Inc. | 29,187 | -1.31 | 852 | -3.30 | ||||
| 2025-05-16 | 13F | Laidlaw Wealth Management LLC | 0 | -100.00 | 0 | |||||
| 2025-08-14 | 13F | GWM Advisors LLC | 5,285 | -30.71 | 154 | -31.86 | ||||
| 2025-05-13 | 13F | Shorepoint Capital Partners LLC | 10,200 | 0.00 | 303 | 1.68 | ||||
| 2025-07-29 | 13F | Harbor Asset Planning, Inc. | 19,251 | 562 | ||||||
| 2025-08-05 | 13F | Dunhill Financial, LLC | 34 | 0.00 | 1 | -100.00 | ||||
| 2025-08-07 | 13F | Cahill Financial Advisors Inc | 75,175 | 0.14 | 2,194 | -1.79 | ||||
| 2025-07-10 | 13F | Wealth Enhancement Advisory Services, Llc | 44,831 | -19.46 | 1,310 | -20.89 | ||||
| 2025-07-15 | 13F | Yarbrough Capital, LLC | 0 | -100.00 | 0 | |||||
| 2025-08-11 | 13F | Private Advisor Group, LLC | 28,414 | -61.82 | 829 | -62.56 | ||||
| 2025-08-07 | 13F | Flagship Wealth Advisors, Llc | 150 | 0.00 | 4 | 0.00 | ||||
| 2025-08-14 | 13F | Bnp Paribas Arbitrage, Sa | 2,422 | 0.00 | 71 | -2.78 | ||||
| 2025-08-14 | 13F/A | Rockefeller Capital Management L.P. | 15,198 | -42.56 | 443 | -43.71 | ||||
| 2025-08-05 | 13F | Scarborough Advisors, LLC | 323 | 9 | ||||||
| 2025-07-23 | 13F | Peak Financial Management, Inc. | 68,031 | -7.40 | 1,985 | -9.15 | ||||
| 2025-05-19 | 13F/A | Trinity Financial Advisors LLC | 0 | -100.00 | 0 | -100.00 | ||||
| 2025-07-23 | 13F | Friedenthal Financial | 109,934 | 5.34 | 3,208 | 3.32 | ||||
| 2025-07-21 | 13F | Ameriflex Group, Inc. | 0 | -100.00 | 0 | |||||
| 2025-07-16 | 13F | Fortune Financial Advisors, LLC | 0 | -100.00 | 0 | |||||
| 2025-08-08 | 13F | Creative Planning | 118,098 | 23.77 | 3,446 | 21.42 | ||||
| 2025-08-14 | 13F | Goldman Sachs Group Inc | 39,781 | 110.56 | 1,161 | 106.41 | ||||
| 2025-05-28 | 13F | Silicon Valley Capital Partners | 101 | 0.00 | 3 | 0.00 | ||||
| 2025-08-01 | 13F | Zhang Financial LLC | 0 | -100.00 | 0 | |||||
| 2025-08-12 | 13F | Steward Partners Investment Advisory, Llc | 1,650 | -78.29 | 48 | -78.76 | ||||
| 2025-08-07 | 13F/A | Joseph Group Capital Management | 3,269 | 0.28 | 95 | -1.04 | ||||
| 2025-08-14 | 13F | UBS Group AG | 136,569 | 35.81 | 3,985 | 33.23 | ||||
| 2025-08-06 | 13F | Commonwealth Equity Services, Llc | 114,840 | -7.52 | 3 | 0.00 | ||||
| 2025-08-12 | 13F | One Charles Private Wealth Services, LLC | 8,980 | 0.00 | 262 | -1.87 | ||||
| 2025-08-07 | 13F | Resources Investment Advisors, LLC. | 10,568 | -2.13 | 308 | -4.05 | ||||
| 2025-08-07 | 13F | Montag A & Associates Inc | 1,662 | -39.08 | 48 | -40.74 | ||||
| 2025-07-01 | 13F | Harbor Investment Advisory, Llc | 5,300 | 0.00 | 155 | -1.91 | ||||
| 2025-08-14 | 13F | Financial Advisory Service, Inc. | 0 | -100.00 | 0 | |||||
| 2025-07-22 | 13F | Berger Financial Group, Inc | 75,710 | -19.60 | 2,209 | -21.14 | ||||
| 2025-08-15 | 13F | Morgan Stanley | 785,996 | 11.16 | 22,935 | 9.03 | ||||
| 2025-08-12 | 13F | AlphaCore Capital LLC | 1,049 | 486.03 | 31 | 500.00 | ||||
| 2025-08-05 | 13F | Sensible Money, LLC | 21,825 | 0.00 | 637 | -2.00 | ||||
| 2025-08-14 | 13F | Wells Fargo & Company/mn | 217,128 | -16.15 | 6,336 | -17.76 | ||||
| 2025-08-14 | 13F | CoreCap Advisors, LLC | 1,540 | 0.00 | 45 | -2.22 | ||||
| 2025-08-18 | 13F | Pacific Center for Financial Services | 701 | 0.29 | 20 | 0.00 | ||||
| 2025-07-17 | 13F | Wagner Wealth Management, Llc | 8,337 | 0.19 | 243 | -1.62 | ||||
| 2025-08-14 | 13F | Acorn Wealth Advisors, LLC | 39,855 | -37.86 | 1,163 | -39.10 | ||||
| 2025-08-07 | 13F | Parkside Financial Bank & Trust | 4,930 | 0.00 | 144 | -2.05 | ||||
| 2025-04-17 | 13F | Pacific Sun Financial Corp | 0 | -100.00 | 0 | |||||
| 2025-08-04 | 13F | Assetmark, Inc | 1,080 | 0.00 | 32 | -3.12 | ||||
| 2025-07-31 | 13F | Cambridge Investment Research Advisors, Inc. | 44,819 | -5.65 | 1 | 0.00 | ||||
| 2025-07-21 | 13F | Rainey & Randall Investment Management Inc. | 102,175 | -85.69 | 2,981 | -85.97 | ||||
| 2025-04-22 | 13F | Jfs Wealth Advisors, Llc | 0 | -100.00 | 0 | -100.00 | ||||
| 2025-07-14 | 13F | UMA Financial Services, Inc. | 130 | 0.00 | 4 | 0.00 | ||||
| 2025-08-14 | 13F | IHT Wealth Management, LLC | 10,446 | -22.66 | 305 | -24.19 | ||||
| 2025-08-05 | 13F | GPS Wealth Strategies Group, LLC | 720 | 0.00 | 21 | 0.00 | ||||
| 2025-08-07 | 13F | PCG Wealth Advisors, LLC | 0 | -100.00 | 0 | |||||
| 2025-07-16 | 13F | Signaturefd, Llc | 1,087 | 0.00 | 32 | -3.12 | ||||
| 2025-08-14 | 13F | LM Advisors LLC | 34,471 | 0.00 | 1 | 0.00 | ||||
| 2025-08-14 | 13F | Raymond James Financial Inc | 347,520 | -2.23 | 10,141 | -4.10 | ||||
| 2025-08-05 | 13F | Bank Of Montreal /can/ | 176,582 | 0.47 | 5,153 | -1.45 | ||||
| 2025-07-30 | 13F | Bogart Wealth, LLC | 5,727 | 0.16 | 167 | -1.76 | ||||
| 2025-08-14 | 13F | Hilltop Holdings Inc. | 13,350 | -1.29 | 390 | -3.23 | ||||
| 2025-05-06 | 13F | Proficio Capital Partners LLC | 0 | -100.00 | 0 | -100.00 | ||||
| 2025-08-07 | 13F | Allworth Financial LP | 24,001 | 0.16 | 700 | 3.55 | ||||
| 2025-08-11 | 13F | United Capital Financial Advisers, Llc | 8,000 | 0.00 | 233 | -2.10 | ||||
| 2025-07-30 | 13F | Avidian Wealth Solutions, LLC | 15,640 | 0.00 | 456 | -1.94 | ||||
| 2025-07-18 | 13F | Eagle Capital Management, LLC | 0 | -100.00 | 0 | |||||
| 2025-07-22 | 13F/A | Red Mountain Financial, LLC | 32,029 | -12.24 | 935 | -13.92 | ||||
| 2025-08-14 | 13F | Mercer Global Advisors Inc /adv | 53,713 | 308.71 | 1,567 | 301.79 | ||||
| 2025-08-19 | 13F | Advisory Services Network, LLC | 10,854 | 10.17 | 303 | 3.41 | ||||
| 2025-07-17 | 13F | Walker Asset Management, LLC | 41,282 | 2.34 | 1,205 | 0.33 | ||||
| 2025-07-22 | 13F | DAVENPORT & Co LLC | 14,669 | -2.82 | 428 | -4.68 | ||||
| 2025-07-24 | 13F | Us Bancorp \de\ | 920 | 0.00 | 27 | -3.70 | ||||
| 2025-09-04 | 13F/A | Advisor Group Holdings, Inc. | 137,564 | 4.27 | 4,014 | 2.27 | ||||
| 2025-08-11 | 13F | Ironsides Asset Advisors, LLC | 37,628 | -0.99 | 1,098 | -2.92 | ||||
| 2025-08-12 | 13F | Bank OZK | 7,800 | 0.00 | 228 | -2.16 | ||||
| 2025-07-07 | 13F | Global Wealth Strategies & Associates | 0 | -100.00 | 0 | |||||
| 2025-08-14 | 13F | Mariner, LLC | 21,523 | 9.23 | 628 | 7.17 | ||||
| 2025-08-04 | 13F | Joseph P. Lucia & Associates, LLC | 117,495 | -3.65 | 3,429 | -5.49 | ||||
| 2025-08-14 | 13F | Allred Capital Management, LLC | 0 | -100.00 | 0 | |||||
| 2025-07-11 | 13F | Kapstone Financial Advisors LLC | 0 | -100.00 | 0 | |||||
| 2025-07-31 | 13F | Oppenheimer & Co Inc | 34,642 | -4.02 | 1,011 | -5.87 | ||||
| 2025-07-29 | 13F | Socha Financial Group, LLC | 8,020 | -53.45 | 234 | -54.30 | ||||
| 2025-07-30 | 13F | Eqis Capital Management, Inc. | 16,522 | -1.54 | 482 | -3.41 | ||||
| 2025-07-11 | 13F | Seacrest Wealth Management, Llc | 0 | -100.00 | 0 | |||||
| 2025-08-11 | 13F | Cascade Wealth Advisors, Inc | 0 | -100.00 | 0 | |||||
| 2025-07-18 | 13F | SOA Wealth Advisors, LLC. | 4,555 | 0.20 | 133 | -2.22 | ||||
| 2025-08-18 | 13F | Geneos Wealth Management Inc. | 13,269 | -7.16 | 387 | -8.94 | ||||
| 2025-08-01 | 13F | Biltmore Family Office, LLC | 37,200 | 0.00 | 1,085 | -1.90 | ||||
| 2025-08-11 | 13F | HHM Wealth Advisors, LLC | 21,645 | 0.00 | 632 | -1.87 | ||||
| 2025-08-14 | 13F | Seven Mile Advisory | 7,000 | 0.00 | 204 | -1.92 | ||||
| 2025-04-29 | 13F | Hm Payson & Co | 0 | -100.00 | 0 | |||||
| 2025-08-13 | 13F | StoneX Group Inc. | 10,119 | 1.18 | 295 | -0.67 | ||||
| 2025-08-14 | 13F | D. E. Shaw & Co., Inc. | 0 | -100.00 | 0 | |||||
| 2025-08-18 | 13F | Front Row Advisors LLC | 550 | 0.00 | 16 | 0.00 | ||||
| 2025-07-16 | 13F/A | CX Institutional | 534 | -79.35 | 0 | |||||
| 2025-08-06 | 13F | North Capital, Inc. | 1,080 | 0.00 | 32 | -3.12 | ||||
| 2025-08-08 | 13F | Financial Gravity Companies, Inc. | 93 | -65.43 | 3 | -71.43 | ||||
| 2025-08-13 | 13F | Green Harvest Asset Management LLC | 129,776 | -1.50 | 3,787 | -3.39 | ||||
| 2025-07-30 | 13F | LGT Financial Advisors LLC | 0 | -100.00 | 0 | |||||
| 2025-08-14 | 13F | Mml Investors Services, Llc | 7,249 | -0.43 | 0 | |||||
| 2025-08-14 | 13F | Citadel Advisors Llc | 69,916 | 584.04 | 2,040 | 571.05 | ||||
| 2025-07-14 | 13F | U.S. Capital Wealth Advisors, LLC | 40,020 | 0.00 | 1,168 | -1.93 | ||||
| 2025-08-14 | 13F | Ameriprise Financial Inc | 124,805 | -12.04 | 3,642 | -13.74 | ||||
| 2025-07-11 | 13F/A | Umb Bank N A/mo | 29,000 | 0.00 | 846 | -1.86 | ||||
| 2025-08-14 | 13F | Royal Bank Of Canada | 355,421 | 2.52 | 10,371 | 0.56 | ||||
| 2025-07-25 | 13F | Cwm, Llc | 2,210 | -12.30 | 0 | |||||
| 2025-07-08 | 13F | Parallel Advisors, LLC | 190 | 0.00 | 6 | 0.00 | ||||
| 2025-07-29 | 13F | Ballast, Inc. | 117,495 | 3,429 | ||||||
| 2025-07-31 | 13F | Perissos Private Wealth Management, LLC | 12,477 | 0.02 | 364 | -1.89 | ||||
| 2025-07-14 | 13F | Occidental Asset Management, LLC | 6,898 | -6.76 | 201 | -8.64 | ||||
| 2025-08-14 | 13F | Stifel Financial Corp | 14,115 | -5.24 | 412 | -7.22 | ||||
| 2025-07-28 | 13F | Harbour Investments, Inc. | 3,412 | 0.09 | 100 | -1.98 | ||||
| 2025-05-08 | 13F | Natixis Advisors, L.p. | 0 | -100.00 | 0 | |||||
| 2025-08-05 | 13F | Huntington National Bank | 314 | -15.82 | ||||||
| 2025-08-14 | 13F | Coastal Bridge Advisors, LLC | 20,035 | -1.77 | 585 | -3.63 | ||||
| 2025-07-17 | 13F | Janney Montgomery Scott LLC | 26,847 | 0.22 | 1 |