Statistik Asas
| Pemilik Institusi | 144 total, 144 long only, 0 short only, 0 long/short - change of 5.84% MRQ |
| Purata Peruntukan Portfolio | 0.0921 % - change of -0.55% MRQ |
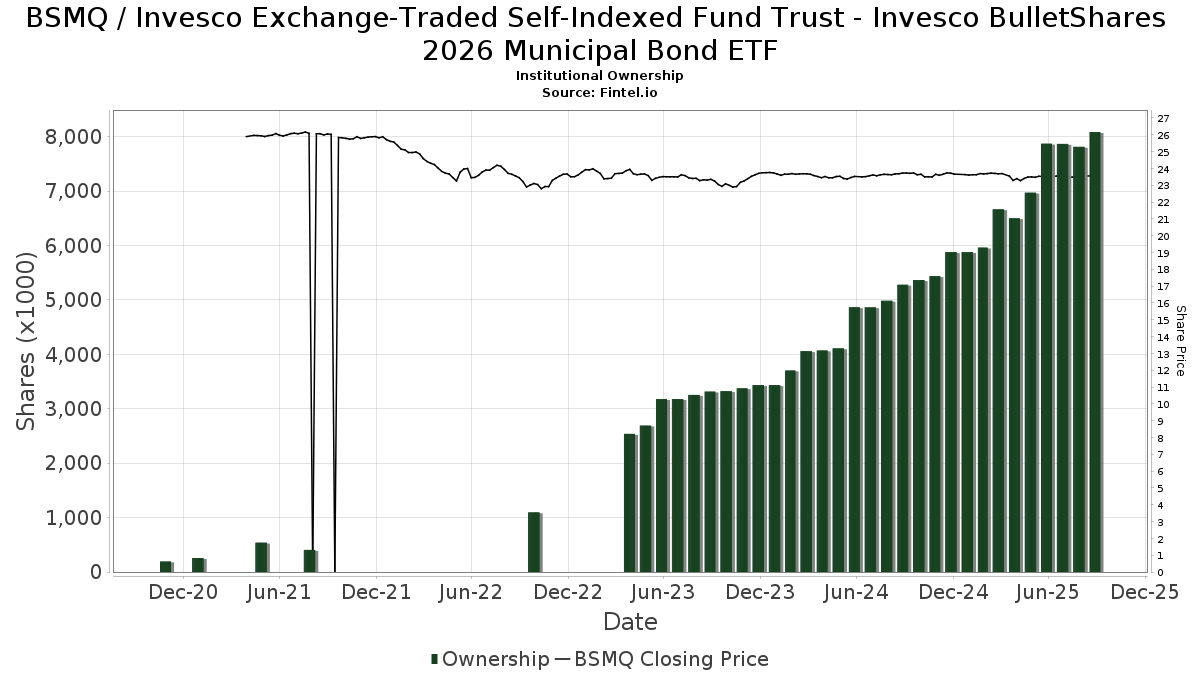
| Saham Institusi (Panjang) | 8,088,533 (ex 13D/G) - change of 0.22MM shares 2.73% MRQ |
| Nilai Institusi (Panjang) | $ 176,705 USD ($1000) |
Pemilikan Institusi dan Pemegang Saham
Invesco Exchange-Traded Self-Indexed Fund Trust - Invesco BulletShares 2026 Municipal Bond ETF (US:BSMQ) telah 144 pemilik institusi dan pemegang saham yang telah memfailkan borang 13D/G atau 13F dengan Suruhanjaya Bursa Sekuriti (SEC). Institusi ini memegang sejumlah 8,088,533 saham. Pemegang saham terbesar termasuk Wells Fargo & Company/mn, LPL Financial LLC, Morgan Stanley, Bank Of America Corp /de/, Truist Financial Corp, Invesco Ltd., Commonwealth Equity Services, Llc, Bank of New York Mellon Corp, Central Valley Advisors, Llc, and UBS Group AG .
Invesco Exchange-Traded Self-Indexed Fund Trust - Invesco BulletShares 2026 Municipal Bond ETF (NasdaqGM:BSMQ) struktur pemilikan institusi menunjukkan kedudukan semasa dalam syarikat mengikut institusi dan dana serta perubahan terkini dalam saiz kedudukan. Pemegang saham utama boleh termasuk pelabur individu, dana amanah, dana lindung nilai atau institusi. Jadual 13D menunjukkan bahawa pelabur memegang (atau menahan) lebih daripada 5% syarikat dan berhasrat (atau berniat) untuk secara aktif meneruskan perubahan dalam strategi perniagaan. Jadual 13G menunjukkan pelaburan pasif melebihi 5%.
The share price as of September 5, 2025 is 23.57 / share. Previously, on September 6, 2024, the share price was 23.71 / share. This represents a decline of 0.59% over that period.
Skor Sentimen Dana
Skor Sentimen Dana (Skor Pengumpulan Pemilikan fka) mencari saham yang paling banyak dibeli oleh dana. Ia adalah hasil daripada model kuantitatif pelbagai faktor yang canggih yang mengenal pasti syarikat dengan tahap pengumpulan institusi tertinggi. Model pemarkahan ini menggunakan gabungan jumlah kenaikan dalam pemilik yang didedahkan, perubahan dalam peruntukan portfolio dalam pemilik tersebut dan metrik lain. Nombornya berjulat dari 0 hingga 100, dengan nombor yang lebih tinggi menunjukkan tahap pengumpulan yang lebih tinggi kepada rakannya, dan 50 adalah nombor purata.
Kekerapan Kemas Kini: Harian
Lihat Peneroka Pemilikan yang menyediakan senarai syarikat yang mempunyai kedudukan tertinggi.
Nisbah Put/Call Institusi
Selain melaporkan isu ekuiti dan hutang standard, institusi yang mempunyai lebih daripada 100MM aset di bawah pengurusan juga mesti mendedahkan pegangan opsyen jual dan beli mereka. Memandangkan opsyen jual secara amnya menunjukkan sentimen negatif, dan opsyen beli menunjukkan sentimen positif, kita boleh mendapatkan gambaran keseluruhan sentimen institusi dengan merencanakan nisbah jual kepada beli. Carta di sebelah kanan memplotkan nisbah jual/beli sejarah untuk instrumen ini.
Menggunakan Nisbah Put/Callsebagai penunjuk sentimen pelabur mengatasi salah satu kekurangan utama menggunakan jumlah pemilikan institusi, iaitu sejumlah besar aset di bawah pengurusan dilaburkan secara pasif untuk menjejaki indeks. Dana yang diurus secara pasif biasanya tidak membeli opsyen, jadi penunjuk nisbah put/call mengekori rapat sentimen dana yang diurus secara aktif.
Pemfailan 13F dan NPORT
Butiran mengenai pemfailan 13F adalah percuma. Perincian mengenai pemfailan NP memerlukan keahlian premium. Baris hijau menunjukkan kedudukan baharu. Baris merah menunjukkan kedudukan tertutup. Klik pautan ikon untuk melihat sejarah transaksi penuh.
Naik Taraf
untuk membuka data premium dan mengeksport ke Excel ![]() .
.
| Tarikh Fail | Sumber | Pelabur | Jenis | Purata Harga (Ang) |
Saham | ΔSaham (%) |
Nilai Dilaporkan ($1000) |
Δ Nilai (%) |
Peruntukan Port (%) |
|
|---|---|---|---|---|---|---|---|---|---|---|
| 2025-07-10 | 13F | Sterling Financial Group, Inc. | 18,408 | -0.83 | 434 | -1.14 | ||||
| 2025-07-14 | 13F | AdvisorNet Financial, Inc | 911 | 0.00 | 21 | 0.00 | ||||
| 2025-07-11 | 13F | Farther Finance Advisors, LLC | 3,026 | 89.12 | 71 | 91.89 | ||||
| 2025-07-09 | 13F | Central Valley Advisors, Llc | 182,424 | -1.44 | 4,298 | -1.67 | ||||
| 2025-07-25 | 13F | Cwm, Llc | 10,796 | 0.67 | 0 | |||||
| 2025-08-06 | 13F | Commonwealth Equity Services, Llc | 291,874 | -5.53 | 7 | -14.29 | ||||
| 2025-08-12 | 13F | Proequities, Inc. | 0 | 0 | ||||||
| 2025-08-06 | 13F | Prospera Financial Services Inc | 12,153 | 0.02 | 286 | 0.00 | ||||
| 2025-07-21 | 13F | Precedent Wealth Partners, Llc | 111,085 | 9.94 | 2,617 | 9.73 | ||||
| 2025-08-13 | 13F | VestGen Advisors, LLC | 149,868 | 1.39 | 3,526 | 1.03 | ||||
| 2025-08-14 | 13F | Royal Bank Of Canada | 22,829 | -0.64 | 538 | -0.74 | ||||
| 2025-07-28 | 13F | Harbour Investments, Inc. | 17,608 | 2.18 | 415 | 1.97 | ||||
| 2025-08-14 | 13F | Integrated Wealth Concepts LLC | 149,088 | 32.55 | 3,513 | 32.28 | ||||
| 2025-07-22 | 13F | Wealthcare Advisory Partners LLC | 17,754 | 6.41 | 418 | 6.36 | ||||
| 2025-08-01 | 13F | Envestnet Asset Management Inc | 170,080 | -19.56 | 4,007 | -19.73 | ||||
| 2025-04-23 | 13F | Creative Financial Designs Inc /adv | 0 | -100.00 | 0 | |||||
| 2025-08-15 | 13F | Cooksen Wealth, LLC | 14,776 | 0.00 | 348 | 0.00 | ||||
| 2025-07-29 | 13F | Wingate Wealth Advisors, Inc. | 15,033 | 0.71 | 354 | 0.57 | ||||
| 2025-07-28 | 13F | Tlwm | 22,458 | 0.00 | 529 | -0.19 | ||||
| 2025-08-11 | 13F | Western Wealth Management, LLC | 10,900 | 257 | ||||||
| 2025-07-08 | 13F | Legacy Private Trust Co. | 73,835 | 14.41 | 1,740 | 14.18 | ||||
| 2025-08-08 | 13F | Cetera Investment Advisers | 15,204 | 9.07 | 358 | 8.81 | ||||
| 2025-08-07 | 13F | Midland Wealth Advisors Llc | 0 | -100.00 | 0 | |||||
| 2025-08-11 | 13F | Aptus Capital Advisors, LLC | 60,907 | 8.24 | 1,435 | 7.98 | ||||
| 2025-08-11 | 13F | Landaas & Co /wi /adv | 9,986 | 235 | ||||||
| 2025-08-12 | 13F | Kohmann Bosshard Financial Services, LLC | 10,302 | 0.00 | 243 | -0.41 | ||||
| 2025-07-17 | 13F | Oak Family Advisors, Llc | 15,338 | 6.97 | 361 | 6.80 | ||||
| 2025-08-08 | 13F | Larson Financial Group LLC | 5,337 | 0.00 | 126 | -0.79 | ||||
| 2025-09-04 | 13F/A | Advisor Group Holdings, Inc. | 170,171 | -7.84 | 4,009 | -8.03 | ||||
| 2025-08-11 | 13F | HighTower Advisors, LLC | 35,457 | 49.34 | 835 | 49.11 | ||||
| 2025-08-14 | 13F | Warren Averett Asset Management, LLC | 23,412 | 13.32 | 552 | 13.14 | ||||
| 2025-07-15 | 13F | Accurate Wealth Management, LLC | 23,724 | 560 | ||||||
| 2025-07-18 | 13F | Truist Financial Corp | 298,961 | -1.06 | 7,044 | -1.26 | ||||
| 2025-07-22 | 13F | Marietta Wealth Management, LLC | 21,245 | 501 | ||||||
| 2025-08-12 | 13F | YANKCOM Partnership | 21,440 | 42.81 | 505 | 42.66 | ||||
| 2025-07-11 | 13F | AA Financial Advisors, LLC | 21,557 | -4.78 | 508 | -5.06 | ||||
| 2025-08-12 | 13F | Cornerstone Wealth Management, LLC | 56,185 | 21.78 | 1,324 | 21.49 | ||||
| 2025-08-19 | 13F | Anchor Investment Management, LLC | 3,000 | 0.00 | 71 | 0.00 | ||||
| 2025-07-21 | 13F | Crews Bank & Trust | 8,475 | 0.00 | 200 | -0.50 | ||||
| 2025-07-28 | 13F | Mutual Advisors, LLC | 8,935 | 210 | ||||||
| 2025-07-23 | 13F | WESPAC Advisors, LLC | 26,036 | 48.78 | 613 | 48.43 | ||||
| 2025-08-08 | 13F | Francis Financial, Inc. | 8,635 | 0.00 | 203 | 0.00 | ||||
| 2025-08-14 | 13F | Foronjy Financial Llc | 22,530 | 531 | ||||||
| 2025-08-14 | 13F | Jane Street Group, Llc | 84,524 | -26.31 | 1,991 | -26.48 | ||||
| 2025-08-14 | 13F | Ameriprise Financial Inc | 10,254 | 242 | ||||||
| 2025-07-15 | 13F | Garrett Investment Advisors LLC | 34,564 | -40.92 | 814 | -41.06 | ||||
| 2025-08-11 | 13F | PAX Financial Group, LLC | 48,414 | -12.59 | 1,141 | -12.78 | ||||
| 2025-07-30 | 13F | Brookstone Capital Management | 9,478 | 0.97 | 223 | 0.90 | ||||
| 2025-08-05 | 13F | Hills Bank & Trust Co | 78,182 | 3.38 | 1,842 | 3.14 | ||||
| 2025-08-12 | 13F | Northeast Planning Associates, Inc. / Nh / | 11,077 | 13.02 | 261 | 12.55 | ||||
| 2025-08-08 | 13F | Pnc Financial Services Group, Inc. | 27,874 | -49.66 | 657 | -49.81 | ||||
| 2025-07-08 | 13F | Webster Bank, N. A. | 11,772 | -12.65 | 277 | -12.89 | ||||
| 2025-07-10 | 13F | Wealth Enhancement Advisory Services, Llc | 26,471 | 0.00 | 623 | -0.16 | ||||
| 2025-08-06 | 13F | Paulson Wealth Management Inc. | 40,104 | -9.92 | 945 | -10.18 | ||||
| 2025-08-12 | 13F | Steward Partners Investment Advisory, Llc | 1,060 | 25 | ||||||
| 2025-07-18 | 13F | Foundry Financial Group, Inc. | 8,500 | 0.00 | 200 | 0.00 | ||||
| 2025-07-16 | 13F | Tassel Capital Management, Inc. | 15,546 | 0.71 | 366 | 0.55 | ||||
| 2025-07-31 | 13F | Resonant Capital Advisors, LLC | 65,489 | -2.99 | 1,543 | -3.20 | ||||
| 2025-08-06 | 13F | SNS Financial Group, LLC | 10,620 | 250 | ||||||
| 2025-08-01 | 13F | First Command Advisory Services, Inc. | 57,914 | 0.56 | 1,364 | 0.37 | ||||
| 2025-08-13 | 13F | Vermillion & White Wealth Management Group, LLC | 28,249 | -27.58 | 666 | -27.72 | ||||
| 2025-08-14 | 13F | Comerica Bank | 3,072 | 0.00 | 72 | 0.00 | ||||
| 2025-07-23 | 13F | Opulen Financial Group LLC | 12,599 | 0.71 | 297 | 0.34 | ||||
| 2025-08-13 | 13F | Farnam Financial LLC | 56,263 | 0.00 | 1,326 | -0.23 | ||||
| 2025-08-11 | 13F | Pinnacle Financial Group, LLC / IL | 0 | -100.00 | 0 | |||||
| 2025-07-25 | 13F | Hobbs Group Advisors, LLC | 19,097 | -47.43 | 450 | -47.61 | ||||
| 2025-08-13 | 13F | Capital Analysts, Inc. | 1,317 | 0.00 | 0 | |||||
| 2025-08-05 | 13F | Bank of New York Mellon Corp | 196,529 | -5.51 | 4,630 | -5.70 | ||||
| 2025-08-12 | 13F | Farmers National Bank | 63,128 | 1.85 | 1,487 | 1.64 | ||||
| 2025-08-13 | 13F | Denver Wealth Management, Inc. | 13,181 | -4.20 | 311 | -4.32 | ||||
| 2025-05-14 | 13F | Change Path, LLC | 0 | -100.00 | 0 | |||||
| 2025-07-10 | 13F | Voisard Asset Management Group, Inc. | 44,212 | 14.65 | 1,042 | 14.40 | ||||
| 2025-08-12 | 13F | OneAscent Financial Services LLC | 132,059 | 7.85 | 3 | 50.00 | ||||
| 2025-08-07 | 13F | Resources Investment Advisors, LLC. | 34,883 | 2.49 | 822 | 2.24 | ||||
| 2025-08-06 | 13F | Atlantic Union Bankshares Corp | 165,321 | 11.55 | 3,895 | 11.29 | ||||
| 2025-08-15 | 13F | Captrust Financial Advisors | 19,556 | 0.00 | 461 | -0.22 | ||||
| 2025-04-11 | 13F | Davis Capital Management | 14,767 | 0.00 | 349 | 0.00 | ||||
| 2025-08-14 | 13F | UBS Group AG | 177,892 | -2.51 | 4,191 | -2.72 | ||||
| 2025-08-01 | 13F | Gwn Securities Inc. | 0 | -100.00 | 0 | |||||
| 2025-08-14 | 13F | Fmr Llc | 69 | -68.35 | 2 | -80.00 | ||||
| 2025-08-05 | 13F | Sigma Planning Corp | 0 | -100.00 | 0 | |||||
| 2025-07-24 | 13F | IFP Advisors, Inc | 1,129 | -37.49 | 27 | -38.10 | ||||
| 2025-07-01 | 13F | Harbor Investment Advisory, Llc | 150 | 0.00 | 4 | 0.00 | ||||
| 2025-07-17 | 13F | Nelson, Van Denburg & Campbell Wealth Management Group, LLC | 9,613 | 0.00 | 226 | 0.00 | ||||
| 2025-08-14 | 13F | IHT Wealth Management, LLC | 13,296 | 0.00 | 313 | 0.00 | ||||
| 2025-07-16 | 13F | Signaturefd, Llc | 41,651 | 0.00 | 981 | -0.20 | ||||
| 2025-08-01 | 13F | Koss-Olinger Consulting, LLC | 31,181 | 188.77 | 735 | 187.84 | ||||
| 2025-08-12 | 13F | Heritage Trust Co | 20,236 | 4.38 | 477 | 4.16 | ||||
| 2025-04-15 | 13F | Members Wealth Llc | 8,485 | 200 | ||||||
| 2025-08-13 | 13F | Brown Advisory Inc | 34,400 | 0.00 | 810 | -0.25 | ||||
| 2025-08-14 | 13F | Benjamin Edwards Inc | 18,310 | -1.64 | 431 | -1.82 | ||||
| 2025-08-11 | 13F | Principal Securities, Inc. | 2,926 | -26.20 | 69 | -26.88 | ||||
| 2025-08-18 | 13F | Geneos Wealth Management Inc. | 375 | 0.00 | 9 | 0.00 | ||||
| 2025-07-14 | 13F | Clear Harbor Asset Management, LLC | 20,415 | 0.20 | 481 | -0.21 | ||||
| 2025-08-14 | 13F | GWM Advisors LLC | 160,743 | 6.17 | 3,787 | 5.96 | ||||
| 2025-07-28 | 13F | BRYN MAWR TRUST Co | 4,214 | 99 | ||||||
| 2025-07-07 | 13F | Horizons Wealth Management | 13,216 | 1.22 | 311 | 0.97 | ||||
| 2025-07-22 | 13F | Knights of Columbus Asset Advisors LLC | 7,050 | 0.00 | 166 | 0.00 | ||||
| 2025-08-13 | 13F | MONECO Advisors, LLC | 129,978 | 45.15 | 3,062 | 44.84 | ||||
| 2025-08-14 | 13F | Colony Group, LLC | 89,748 | 10.91 | 2,114 | 10.68 | ||||
| 2025-08-05 | 13F | Key FInancial Inc | 104,371 | 6.28 | 2,459 | 6.04 | ||||
| 2025-08-12 | 13F | Jacobi Capital Management LLC | 12,176 | 24.55 | 287 | 24.35 | ||||
| 2025-08-13 | 13F | Beacon Pointe Advisors, LLC | 31,179 | -0.66 | 735 | -0.94 | ||||
| 2025-08-14 | 13F | Diversify Advisory Services, LLC | 9,169 | 0.73 | 216 | 1.42 | ||||
| 2025-08-15 | 13F | Morgan Stanley | 462,536 | -8.94 | 10,897 | -9.14 | ||||
| 2025-07-25 | 13F | Yarger Wealth Strategies, Llc | 17,082 | 402 | ||||||
| 2025-08-13 | 13F | Jones Financial Companies Lllp | 18,091 | 91.18 | 426 | 90.58 | ||||
| 2025-08-13 | 13F | Northwestern Mutual Wealth Management Co | 79,348 | -5.07 | 1,869 | -5.27 | ||||
| 2025-08-14 | 13F | Wells Fargo & Company/mn | 640,934 | 1.19 | 15,100 | 0.98 | ||||
| 2025-08-19 | 13F | Advisory Services Network, LLC | 10,410 | 244 | ||||||
| 2025-08-01 | 13F | Clark Asset Management, LLC | 27,830 | 29.94 | 656 | 29.70 | ||||
| 2025-07-17 | 13F | Venture Visionary Partners LLC | 11,363 | 0.00 | 268 | -0.37 | ||||
| 2025-08-13 | 13F | Flow Traders U.s. Llc | 0 | -100.00 | 0 | |||||
| 2025-07-01 | 13F | Confluence Investment Management Llc | 110,838 | -3.06 | 2,611 | -3.26 | ||||
| 2025-08-14 | 13F | Bank Of America Corp /de/ | 340,698 | 15.96 | 8,027 | 15.72 | ||||
| 2025-08-14 | 13F | Stifel Financial Corp | 57,444 | 15.20 | 1,353 | 14.95 | ||||
| 2025-08-04 | 13F | AlphaStar Capital Management, LLC | 46,348 | 14.44 | 1,092 | 14.12 | ||||
| 2025-07-25 | 13F | Astoria Portfolio Advisors LLC. | 36,626 | -22.93 | 861 | -22.17 | ||||
| 2025-08-26 | 13F/A | Thrivent Financial For Lutherans | 67,542 | 395.94 | 2 | |||||
| 2025-08-12 | 13F | Jpmorgan Chase & Co | 0 | -100.00 | 0 | |||||
| 2025-08-14 | 13F | Mml Investors Services, Llc | 81,897 | 20.26 | 2 | 0.00 | ||||
| 2025-08-07 | 13F | Addison Advisors LLC | 15,000 | -4.21 | 353 | -4.34 | ||||
| 2025-07-16 | 13F | ORG Partners LLC | 850 | 0.00 | 20 | 0.00 | ||||
| 2025-08-11 | 13F | Private Advisor Group, LLC | 32,899 | 17.83 | 775 | 17.60 | ||||
| 2025-07-22 | 13F | Kickstand Ventures, Llc. | 18,536 | 14.46 | 437 | 14.14 | ||||
| 2025-08-08 | 13F | Meridian Wealth Management, LLC | 32,532 | 0.00 | 766 | -0.26 | ||||
| 2025-08-14 | 13F | EP Wealth Advisors, Inc. | 12,016 | -26.61 | 283 | -26.68 | ||||
| 2025-07-14 | 13F | Sentinel Pension Advisors Inc | 37,957 | -2.04 | 894 | -2.19 | ||||
| 2025-07-22 | 13F | Duncan Williams Asset Management, LLC | 18,536 | 437 | ||||||
| 2025-08-11 | 13F | Elequin Capital Lp | 27,234 | 642 | ||||||
| 2025-07-28 | 13F | Axxcess Wealth Management, Llc | 8,993 | 212 | ||||||
| 2025-08-11 | 13F | Howard Wealth Management, Llc | 14,685 | 16.46 | 346 | 16.16 | ||||
| 2025-08-13 | 13F | Cary Street Partners Financial Llc | 8,950 | 0.00 | 211 | -0.47 | ||||
| 2025-08-06 | 13F | Savant Capital, LLC | 30,660 | 0.06 | 722 | -0.14 | ||||
| 2025-03-25 | 13F | Higgins & Schmidt Wealth Strategies LLC | 0 | -100.00 | 0 | -100.00 | ||||
| 2025-08-05 | 13F | Huntington National Bank | 338 | -40.04 | ||||||
| 2025-08-19 | 13F | Asset Dedication, LLC | 131,581 | 14.54 | 3,100 | 14.31 | ||||
| 2025-08-14 | 13F | Raymond James Financial Inc | 159,077 | 4.26 | 3,748 | 4.03 | ||||
| 2025-04-15 | 13F | Collier Financial | 11,195 | -19.32 | 264 | -19.27 | ||||
| 2025-08-13 | 13F | Invesco Ltd. | 296,072 | 4.27 | 6,975 | 4.04 | ||||
| 2025-08-12 | 13F | MAI Capital Management | 1,375 | 0.73 | 32 | 0.00 | ||||
| 2025-08-15 | 13F | Equitable Holdings, Inc. | 10,797 | -18.74 | 254 | -18.85 | ||||
| 2025-08-25 | 13F | Silverlake Wealth Management Llc | 13,083 | 0.00 | 308 | 0.00 | ||||
| 2025-08-12 | 13F | LPL Financial LLC | 500,997 | 18.43 | 11,803 | 18.18 | ||||
| 2025-08-13 | 13F | Lido Advisors, LLC | 27,410 | 8.73 | 646 | 8.40 | ||||
| 2025-07-29 | 13F | Latitude Advisors, LLC | 0 | -100.00 | 0 | |||||
| 2025-07-10 | 13F | Focus Financial Network, Inc. | 39,126 | -50.31 | 922 | -50.46 | ||||
| 2025-07-25 | 13F | Bill Few Associates, Inc. | 17,462 | 0.00 | 411 | -0.24 | ||||
| 2025-08-13 | 13F | StoneX Group Inc. | 22,224 | -21.61 | 524 | -21.82 | ||||
| 2025-07-16 | 13F | Kathmere Capital Management, LLC | 55,773 | 150.97 | 1,314 | 150.76 | ||||
| 2025-07-29 | 13F | Private Trust Co Na | 12,125 | -24.57 | 286 | -24.80 | ||||
| 2025-07-31 | 13F | Carnegie Capital Asset Management, LLC | 23,685 | -16.85 | 558 | -16.34 | ||||
| 2025-07-21 | 13F | Old Second National Bank Of Aurora | 5,744 | -27.08 | 135 | -27.03 | ||||
| 2025-07-30 | 13F | Eqis Capital Management, Inc. | 11,926 | -4.52 | 281 | -4.76 | ||||
| 2025-07-14 | 13F | Masso Torrence Wealth Management Inc. | 12,953 | 8.37 | 305 | 8.16 | ||||
| 2025-08-04 | 13F | Atria Investments Llc | 0 | -100.00 | 0 | |||||
| 2025-07-21 | 13F | River Street Advisors LLC | 18,302 | 431 |