Statistik Asas
| Pemilik Institusi | 186 total, 186 long only, 0 short only, 0 long/short - change of 0.00% MRQ |
| Purata Peruntukan Portfolio | 0.2903 % - change of -6.38% MRQ |
| Saham Institusi (Panjang) | 22,707,449 (ex 13D/G) - change of -0.87MM shares -3.71% MRQ |
| Nilai Institusi (Panjang) | $ 590,865 USD ($1000) |
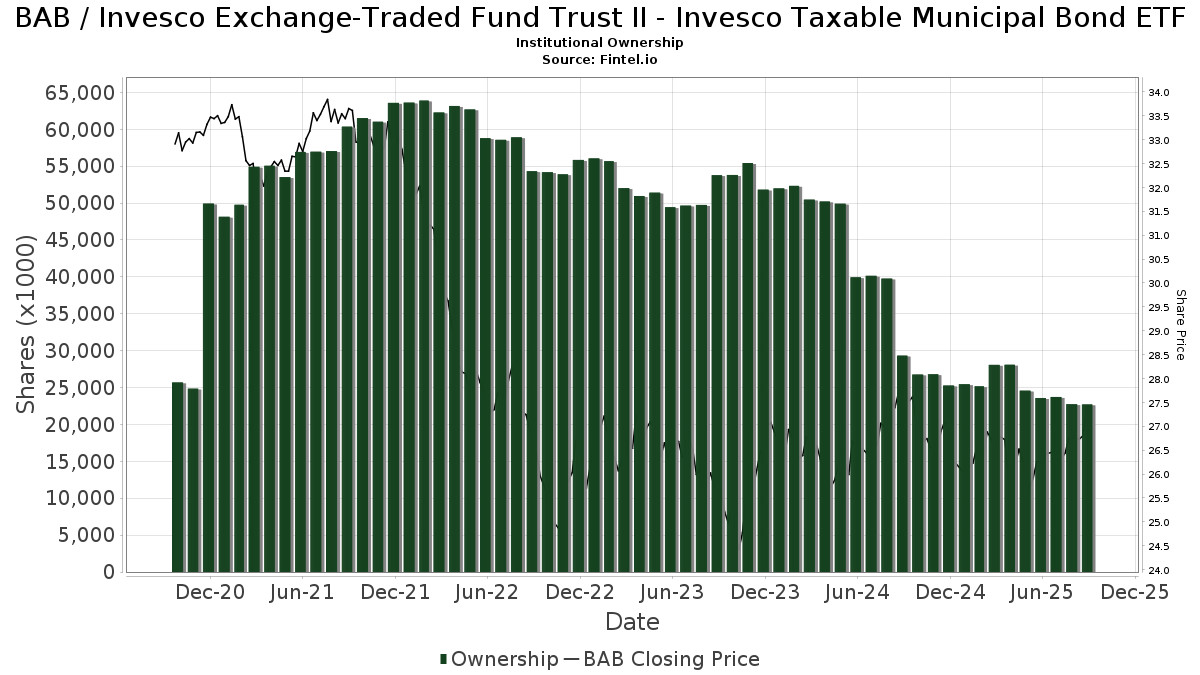
Pemilikan Institusi dan Pemegang Saham
Invesco Exchange-Traded Fund Trust II - Invesco Taxable Municipal Bond ETF (US:BAB) telah 186 pemilik institusi dan pemegang saham yang telah memfailkan borang 13D/G atau 13F dengan Suruhanjaya Bursa Sekuriti (SEC). Institusi ini memegang sejumlah 22,707,449 saham. Pemegang saham terbesar termasuk Raymond James Financial Inc, HighTower Advisors, LLC, State Of Wisconsin Investment Board, Ameriprise Financial Inc, Bank Of America Corp /de/, UBS Group AG, Envestnet Asset Management Inc, Bank Of Montreal /can/, Pnc Financial Services Group, Inc., and Sumitomo Mitsui Financial Group, Inc. .
Invesco Exchange-Traded Fund Trust II - Invesco Taxable Municipal Bond ETF (ARCA:BAB) struktur pemilikan institusi menunjukkan kedudukan semasa dalam syarikat mengikut institusi dan dana serta perubahan terkini dalam saiz kedudukan. Pemegang saham utama boleh termasuk pelabur individu, dana amanah, dana lindung nilai atau institusi. Jadual 13D menunjukkan bahawa pelabur memegang (atau menahan) lebih daripada 5% syarikat dan berhasrat (atau berniat) untuk secara aktif meneruskan perubahan dalam strategi perniagaan. Jadual 13G menunjukkan pelaburan pasif melebihi 5%.
The share price as of September 5, 2025 is 27.04 / share. Previously, on September 9, 2024, the share price was 27.89 / share. This represents a decline of 3.07% over that period.
Skor Sentimen Dana
Skor Sentimen Dana (Skor Pengumpulan Pemilikan fka) mencari saham yang paling banyak dibeli oleh dana. Ia adalah hasil daripada model kuantitatif pelbagai faktor yang canggih yang mengenal pasti syarikat dengan tahap pengumpulan institusi tertinggi. Model pemarkahan ini menggunakan gabungan jumlah kenaikan dalam pemilik yang didedahkan, perubahan dalam peruntukan portfolio dalam pemilik tersebut dan metrik lain. Nombornya berjulat dari 0 hingga 100, dengan nombor yang lebih tinggi menunjukkan tahap pengumpulan yang lebih tinggi kepada rakannya, dan 50 adalah nombor purata.
Kekerapan Kemas Kini: Harian
Lihat Peneroka Pemilikan yang menyediakan senarai syarikat yang mempunyai kedudukan tertinggi.
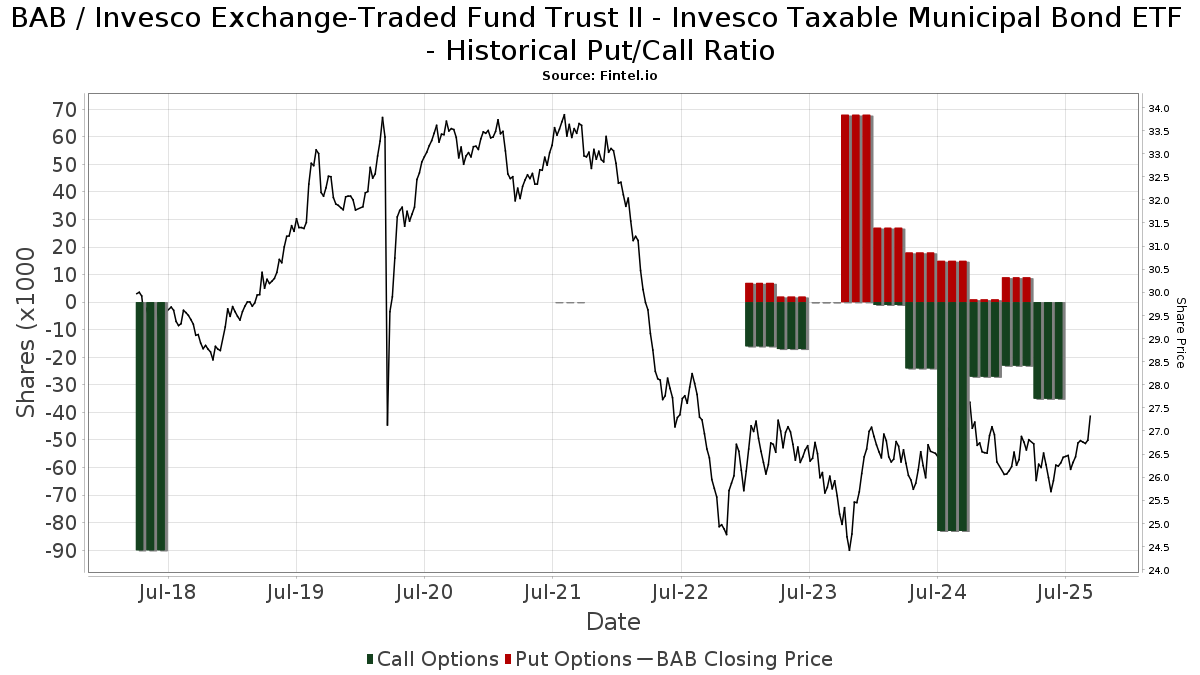
Nisbah Put/Call Institusi
Selain melaporkan isu ekuiti dan hutang standard, institusi yang mempunyai lebih daripada 100MM aset di bawah pengurusan juga mesti mendedahkan pegangan opsyen jual dan beli mereka. Memandangkan opsyen jual secara amnya menunjukkan sentimen negatif, dan opsyen beli menunjukkan sentimen positif, kita boleh mendapatkan gambaran keseluruhan sentimen institusi dengan merencanakan nisbah jual kepada beli. Carta di sebelah kanan memplotkan nisbah jual/beli sejarah untuk instrumen ini.
Menggunakan Nisbah Put/Callsebagai penunjuk sentimen pelabur mengatasi salah satu kekurangan utama menggunakan jumlah pemilikan institusi, iaitu sejumlah besar aset di bawah pengurusan dilaburkan secara pasif untuk menjejaki indeks. Dana yang diurus secara pasif biasanya tidak membeli opsyen, jadi penunjuk nisbah put/call mengekori rapat sentimen dana yang diurus secara aktif.
Pemfailan 13F dan NPORT
Butiran mengenai pemfailan 13F adalah percuma. Perincian mengenai pemfailan NP memerlukan keahlian premium. Baris hijau menunjukkan kedudukan baharu. Baris merah menunjukkan kedudukan tertutup. Klik pautan ikon untuk melihat sejarah transaksi penuh.
Naik Taraf
untuk membuka data premium dan mengeksport ke Excel ![]() .
.
| Tarikh Fail | Sumber | Pelabur | Jenis | Purata Harga (Ang) |
Saham | ΔSaham (%) |
Nilai Dilaporkan ($1000) |
Δ Nilai (%) |
Peruntukan Port (%) |
|
|---|---|---|---|---|---|---|---|---|---|---|
| 2025-07-28 | 13F | Harbour Investments, Inc. | 5,824 | 25.65 | 155 | 25.20 | ||||
| 2025-08-06 | 13F | Moors & Cabot, Inc. | 14,417 | 382 | ||||||
| 2025-07-21 | 13F | Ameritas Advisory Services, LLC | 380 | 10 | ||||||
| 2025-08-12 | 13F | Change Path, LLC | 8,768 | -5.23 | 233 | -5.69 | ||||
| 2025-08-08 | 13F | Wrapmanager Inc | 114,938 | 13.50 | 3,049 | 12.88 | ||||
| 2025-08-14 | 13F | Wiley Bros.-aintree Capital, Llc | 40,072 | 345.29 | 1,063 | 344.77 | ||||
| 2025-08-12 | 13F | Franklin Resources Inc | 40 | 1 | ||||||
| 2025-08-12 | 13F | Archer Investment Corp | 400 | 0.00 | 11 | 0.00 | ||||
| 2025-08-08 | 13F | Hartland & Co., LLC | 0 | -100.00 | 0 | |||||
| 2025-08-08 | 13F | United Asset Strategies, Inc. | 22,330 | -68.45 | 592 | -68.64 | ||||
| 2025-08-07 | 13F | Donaldson Capital Management, Llc | 43,888 | -0.58 | 1,164 | -1.10 | ||||
| 2025-08-11 | 13F | Principal Securities, Inc. | 0 | -100.00 | 0 | |||||
| 2025-07-24 | 13F | Blair William & Co/il | 2,905 | -54.37 | 77 | -54.44 | ||||
| 2025-04-15 | 13F | First United Bank Trust/ | 0 | -100.00 | 0 | |||||
| 2025-07-14 | 13F | Opal Wealth Advisors, LLC | 3,093 | 116.60 | 82 | 115.79 | ||||
| 2025-07-23 | 13F | Family Legacy, Inc. | 43,216 | 1.07 | 1,147 | 0.53 | ||||
| 2025-07-17 | 13F | Janney Montgomery Scott LLC | 29,641 | 2.22 | 1 | |||||
| 2025-08-11 | 13F | Aptus Capital Advisors, LLC | 1,050 | 0.00 | 28 | -3.57 | ||||
| 2025-05-14 | 13F | Caitlin John, LLC | 0 | -100.00 | 0 | |||||
| 2025-08-11 | 13F | HighTower Advisors, LLC | 1,319,358 | 3.83 | 35,003 | 3.24 | ||||
| 2025-09-04 | 13F/A | Advisor Group Holdings, Inc. | 106,096 | 18.32 | 2,815 | 17.64 | ||||
| 2025-07-23 | 13F | Prime Capital Investment Advisors, LLC | 9,890 | -27.09 | 262 | -27.42 | ||||
| 2025-08-04 | 13F | Atria Investments Llc | 7,980 | -39.51 | 212 | -83.95 | ||||
| 2025-08-08 | 13F | Cetera Investment Advisers | 81,990 | -0.03 | 2,175 | -0.59 | ||||
| 2025-08-15 | 13F | CI Private Wealth, LLC | 120,685 | -4.69 | 3,202 | -5.24 | ||||
| 2025-07-25 | 13F | Apollon Wealth Management, LLC | 7,926 | 210 | ||||||
| 2025-07-25 | 13F | Cwm, Llc | 805 | 73.87 | 0 | |||||
| 2025-08-08 | 13F | Tortoise Investment Management, LLC | 386,850 | -0.75 | 10,263 | -1.31 | ||||
| 2025-08-15 | 13F | Morgan Stanley | 497,211 | -2.69 | 13,191 | -3.24 | ||||
| 2025-05-15 | 13F | Vermillion & White Wealth Management Group, LLC | 0 | -100.00 | 0 | |||||
| 2025-08-11 | 13F | Wealthspire Advisors, LLC | 216,111 | -11.54 | 5,733 | -12.04 | ||||
| 2025-08-14 | 13F | Money Concepts Capital Corp | 117,281 | 1.08 | 3,111 | 0.52 | ||||
| 2025-08-13 | 13F | Cerity Partners LLC | 30,161 | -1.51 | 800 | -1.96 | ||||
| 2025-05-13 | 13F | Sequent Planning LLC | 0 | -100.00 | 0 | |||||
| 2025-05-08 | 13F | Us Bancorp \de\ | 0 | -100.00 | 0 | |||||
| 2025-07-22 | 13F | Glassy Mountain Advisors, Inc. | 36,260 | 2.14 | 962 | 1.48 | ||||
| 2025-08-14 | 13F | Susquehanna International Group, Llp | 9,255 | -8.48 | 246 | -8.92 | ||||
| 2025-08-04 | 13F | Keybank National Association/oh | 180,630 | -0.47 | 4,792 | -1.03 | ||||
| 2025-07-31 | 13F | Rational Advisors Llc | 157,852 | -67.38 | 4,188 | -67.57 | ||||
| 2025-07-29 | 13F | Shelter Mutual Insurance Co | 198,589 | 0.00 | 5,269 | -0.57 | ||||
| 2025-08-15 | 13F | Kestra Advisory Services, LLC | 49,097 | 12.32 | 1,303 | 11.66 | ||||
| 2025-08-14 | 13F/A | Barclays Plc | 200,000 | 0.00 | 5 | 0.00 | ||||
| 2025-08-12 | 13F | Jpmorgan Chase & Co | 58,335 | -10.42 | 1,548 | -10.94 | ||||
| 2025-07-24 | 13F | Conning Inc. | 490,000 | 0.00 | 13,000 | -0.57 | ||||
| 2025-08-14 | 13F | Quartz Partners, LLC | 0 | -100.00 | 0 | |||||
| 2025-08-14 | 13F | Cibc World Markets Corp | 13,936 | -65.83 | 370 | -66.08 | ||||
| 2025-08-14 | 13F | Comerica Bank | 11,220 | 0.20 | 298 | -0.34 | ||||
| 2025-07-28 | 13F | Hudson Capital Management LLC | 110,915 | -2.67 | 2,943 | -3.22 | ||||
| 2025-08-01 | 13F | Advisory Alpha, LLC | 70,669 | 33.76 | 1,875 | 33.00 | ||||
| 2025-07-18 | 13F | PFG Investments, LLC | 61,260 | 0.78 | 1,625 | 0.25 | ||||
| 2025-08-14 | 13F | Garden State Investment Advisory Services LLC | 8,674 | 0.00 | 230 | -0.43 | ||||
| 2025-08-14 | 13F | Citadel Advisors Llc | Put | 0 | -100.00 | 0 | ||||
| 2025-07-21 | 13F | Mirae Asset Global Investments Co., Ltd. | 96,940 | 18.25 | 2,572 | 18.10 | ||||
| 2025-07-25 | 13F | Atria Wealth Solutions, Inc. | 14,355 | 3.98 | 381 | 3.26 | ||||
| 2025-07-10 | 13F | Tompkins Financial Corp | 221 | 0.00 | 6 | 0.00 | ||||
| 2025-07-23 | 13F | Ti-trust, Inc | 73,462 | 30.12 | 1,949 | 29.35 | ||||
| 2025-07-14 | 13F | Park Avenue Securities Llc | 18,829 | -0.44 | 0 | |||||
| 2025-08-14 | 13F | Lazard Asset Management Llc | 0 | |||||||
| 2025-08-08 | 13F | Pnc Financial Services Group, Inc. | 735,073 | -13.74 | 19,501 | -14.22 | ||||
| 2025-08-05 | 13F | Gould Asset Management Llc /ca/ | 600,486 | 7.25 | 15,931 | 6.64 | ||||
| 2025-08-14 | 13F | Smartleaf Asset Management LLC | 47,027 | -0.99 | 1,243 | -1.51 | ||||
| 2025-05-06 | 13F | Kovack Advisors, Inc. | 0 | -100.00 | 0 | |||||
| 2025-08-06 | 13F | Stokes Family Office, LLC | 12,800 | 0.00 | 340 | -0.59 | ||||
| 2025-07-24 | 13F | Trust Co Of Toledo Na /oh/ | 849 | 23 | ||||||
| 2025-07-29 | NP | MAMB - Monarch Ambassador Income ETF | 298,728 | 4.27 | 7,809 | 1.21 | ||||
| 2025-08-11 | 13F | Citigroup Inc | 4 | 0 | ||||||
| 2025-08-14 | 13F | Wells Fargo & Company/mn | 665,889 | 2.43 | 17,666 | 1.86 | ||||
| 2025-08-05 | 13F | Tsfg, Llc | 306 | 2.00 | 0 | |||||
| 2025-04-30 | 13F | Allworth Financial LP | 0 | -100.00 | 0 | |||||
| 2025-07-24 | 13F | IFP Advisors, Inc | 2,862 | -1.58 | 76 | -2.60 | ||||
| 2025-07-10 | 13F | Anderson Hoagland & Co | 64,267 | -1.65 | 1,705 | 0.06 | ||||
| 2025-08-13 | 13F | Flow Traders U.s. Llc | 0 | -100.00 | 0 | |||||
| 2025-08-13 | 13F | StoneX Group Inc. | 0 | -100.00 | 0 | -100.00 | ||||
| 2025-05-01 | 13F | Quest 10 Wealth Builders, Inc. | 210 | 0.00 | 6 | 0.00 | ||||
| 2025-07-11 | 13F | Farther Finance Advisors, LLC | 15 | 0.00 | 0 | |||||
| 2025-08-14 | 13F | Jane Street Group, Llc | 565,488 | 44.42 | 15,002 | 43.61 | ||||
| 2025-07-07 | 13F | Bangor Savings Bank | 27,533 | -19.78 | 730 | -20.22 | ||||
| 2025-04-23 | 13F | Creative Financial Designs Inc /adv | 0 | -100.00 | 0 | |||||
| 2025-08-11 | 13F | Nations Financial Group Inc, /ia/ /adv | 12,374 | 3.60 | 328 | 3.14 | ||||
| 2025-08-12 | 13F | CIBC Private Wealth Group, LLC | 2,155 | 0.00 | 57 | 1.79 | ||||
| 2025-08-14 | 13F | Qube Research & Technologies Ltd | 0 | -100.00 | 0 | |||||
| 2025-08-13 | 13F | Jones Financial Companies Lllp | 104,132 | -7.27 | 2,752 | -7.71 | ||||
| 2025-07-08 | 13F | Nbc Securities, Inc. | 13,907 | -4.48 | 0 | |||||
| 2025-08-07 | 13F | Samalin Investment Counsel, LLC | 9,336 | 0.09 | 248 | -0.40 | ||||
| 2025-07-29 | 13F | Stephens Inc /ar/ | 13,435 | 1.25 | 356 | 0.56 | ||||
| 2025-08-14 | 13F | Millennium Management Llc | 9,945 | 264 | ||||||
| 2025-08-07 | 13F | CENTRAL TRUST Co | 250 | 0.00 | 7 | 0.00 | ||||
| 2025-08-13 | 13F | D L Carlson Investment Group Inc | 56,559 | -41.77 | 1,501 | -42.11 | ||||
| 2025-08-04 | 13F | Savvy Advisors, Inc. | 35,943 | 5.03 | 954 | 4.38 | ||||
| 2025-07-17 | 13F | Oceanside Advisors LLC | 107,036 | 4.01 | 2,840 | 3.42 | ||||
| 2025-08-11 | 13F | Private Advisor Group, LLC | 54,861 | -0.84 | 1,455 | -1.42 | ||||
| 2025-06-26 | NP | HNDL - Strategy Shares Nasdaq 7 HANDL(TM) Index ETF | 466,004 | 35.66 | 12,358 | 36.60 | ||||
| 2025-07-15 | 13F | Farrell Financial LLC | 8,267 | 0.92 | 219 | 0.46 | ||||
| 2025-07-17 | 13F | Wolff Wiese Magana Llc | 350 | 0.00 | 9 | 0.00 | ||||
| 2025-07-17 | 13F | City Holding Co | 180 | -51.22 | 5 | -55.56 | ||||
| 2025-08-07 | 13F | Roberts Glore & Co Inc /il/ | 48,002 | 0.00 | 1,273 | -0.55 | ||||
| 2025-07-07 | 13F | Thurston, Springer, Miller, Herd & Titak, Inc. | 1,461 | 0.00 | 39 | 0.00 | ||||
| 2025-07-15 | 13F | Capstone Capital Wealth Advisors | 26,257 | 0.00 | 697 | -0.57 | ||||
| 2025-06-30 | NP | Northern Lights Fund Trust - PFG Fidelity Institutional AM(R) Bond ESG Strategy Class R Shares | 222,053 | 6.54 | 5,889 | 7.27 | ||||
| 2025-07-31 | 13F/A | Avion Wealth | 230 | 0.00 | 0 | |||||
| 2025-08-18 | 13F/A | National Bank Of Canada /fi/ | 1,450 | 11.97 | 38 | 11.76 | ||||
| 2025-08-14 | 13F | UBS Group AG | 774,495 | 1.94 | 20,547 | 1.37 | ||||
| 2025-07-29 | 13F | Private Trust Co Na | 10,299 | 2.12 | 273 | 1.49 | ||||
| 2025-08-12 | 13F | Centric Wealth Management | 23,222 | -0.54 | 619 | -0.64 | ||||
| 2025-08-11 | 13F | Rothschild Investment Llc | 17,625 | 0.00 | 468 | -0.64 | ||||
| 2025-07-29 | 13F | Koshinski Asset Management, Inc. | 15,213 | 0.00 | 404 | -0.49 | ||||
| 2025-08-07 | 13F | Winthrop Capital Management, LLC | 360 | 0.00 | 0 | |||||
| 2025-08-11 | 13F | Traub Capital Management LLC | 12,440 | 330 | ||||||
| 2025-08-14 | 13F | Engineers Gate Manager LP | 13,554 | 360 | ||||||
| 2025-07-25 | 13F | We Are One Seven, LLC | 27,244 | -7.33 | 723 | -7.91 | ||||
| 2025-04-21 | 13F | Envestnet Portfolio Solutions, Inc. | 0 | -100.00 | 0 | |||||
| 2025-05-15 | 13F/A | Orion Portfolio Solutions, LLC | 15,299 | 408 | ||||||
| 2025-05-08 | 13F | Hoxton Planning & Management, LLC | 0 | -100.00 | 0 | |||||
| 2025-05-08 | 13F | Great Valley Advisor Group, Inc. | 0 | -100.00 | 0 | -100.00 | ||||
| 2025-08-06 | 13F | Commonwealth Equity Services, Llc | 32,119 | -3.78 | 1 | |||||
| 2025-08-05 | 13F | Simplex Trading, Llc | 0 | -100.00 | 0 | |||||
| 2025-08-13 | 13F | Cresset Asset Management, LLC | 10,032 | 0.02 | 266 | -0.37 | ||||
| 2025-08-14 | 13F | Citadel Advisors Llc | Call | 35,800 | 55.65 | 950 | 54.81 | |||
| 2025-08-14 | 13F | Citadel Advisors Llc | 31,150 | 119.64 | 826 | 118.52 | ||||
| 2025-08-08 | 13F | Capital Investment Advisory Services, LLC | 3,028 | 0.00 | 80 | 0.00 | ||||
| 2025-08-14 | 13F | Bnp Paribas Arbitrage, Sa | 44,517 | -69.44 | 1,181 | -69.61 | ||||
| 2025-08-13 | 13F | Sumitomo Mitsui Financial Group, Inc. | 681,581 | -8.01 | 18,082 | -8.53 | ||||
| 2025-08-14 | 13F | Mml Investors Services, Llc | 66,606 | -50.51 | 2 | -66.67 | ||||
| 2025-08-14 | 13F | Raymond James Financial Inc | 1,537,781 | 0.31 | 40,797 | -0.26 | ||||
| 2025-08-14 | 13F | Modern Wealth Management, LLC | 40,618 | 1,078 | ||||||
| 2025-07-30 | 13F | Onyx Bridge Wealth Group LLC | 38,841 | -89.86 | 1,030 | -89.92 | ||||
| 2025-08-04 | 13F | Pensionmark Financial Group, Llc | 27,026 | 5.62 | 717 | 5.13 | ||||
| 2025-07-18 | 13F | Truist Financial Corp | 193,361 | -6.29 | 5,130 | -6.81 | ||||
| 2025-08-12 | 13F | Proequities, Inc. | 0 | 0 | ||||||
| 2025-08-12 | 13F | AlphaCore Capital LLC | 1,250 | 33 | ||||||
| 2025-05-15 | 13F | Gwn Securities Inc. | 0 | -100.00 | 0 | |||||
| 2025-07-10 | 13F | Peoples Bank/KS | 0 | -100.00 | 0 | |||||
| 2025-08-14 | 13F | State Of Wisconsin Investment Board | 1,318,800 | 0.00 | 34,988 | -0.56 | ||||
| 2025-08-01 | 13F | Schmidt P J Investment Management Inc | 0 | -100.00 | 0 | |||||
| 2025-07-31 | 13F | Oppenheimer & Co Inc | 19,974 | -1.96 | 530 | -2.58 | ||||
| 2025-05-09 | 13F | GeoWealth Management, LLC | 0 | -100.00 | 0 | |||||
| 2025-05-12 | 13F | Commons Capital, Llc | 0 | -100.00 | 0 | |||||
| 2025-08-12 | 13F | SRS Capital Advisors, Inc. | 2,376 | 0.00 | 63 | 0.00 | ||||
| 2025-06-26 | NP | FIRS - FIRE Funds(TM) Wealth Builder ETF | 4,917 | 200.00 | 130 | 202.33 | ||||
| 2025-08-07 | 13F | 1620 Investment Advisors, Inc. | 1,165 | 0.00 | 31 | -3.23 | ||||
| 2025-08-14 | 13F | GWM Advisors LLC | 57,685 | 6.52 | 1,530 | 5.96 | ||||
| 2025-08-12 | 13F | Global Retirement Partners, LLC | 4,334 | 634.58 | 115 | 660.00 | ||||
| 2025-07-30 | 13F | Whittier Trust Co Of Nevada Inc | 9,089 | -19.88 | 241 | -20.20 | ||||
| 2025-08-14 | 13F | STAR Financial Bank | 59,909 | 39.19 | 1,589 | 38.41 | ||||
| 2025-08-05 | 13F | Bank of New York Mellon Corp | 367,643 | 2.71 | 9,754 | 2.13 | ||||
| 2025-08-13 | 13F | Baker Avenue Asset Management, LP | 0 | -100.00 | 0 | |||||
| 2025-07-30 | 13F | Whittier Trust Co | 4,033 | 0.00 | 107 | -0.93 | ||||
| 2025-07-11 | 13F | Caldwell Securities, Inc | 450 | 0.00 | 12 | -8.33 | ||||
| 2025-07-30 | 13F | Patten Group, Inc. | 86,140 | -4.68 | 2,285 | -5.23 | ||||
| 2025-08-14 | 13F | Brinker Capital Investments, LLC | 0 | -100.00 | 0 | |||||
| 2025-08-18 | 13F | Hershey Financial Advisers, LLC | 133,502 | 3,542 | ||||||
| 2025-08-12 | 13F | Country Trust Bank | 140,000 | 0.00 | 3,714 | -0.56 | ||||
| 2025-07-31 | 13F | Ssa Swiss Advisors Ag | 45,186 | -8.47 | 1,190 | -9.51 | ||||
| 2025-08-14 | 13F/A | Rockefeller Capital Management L.P. | 16,340 | 0.88 | 434 | 0.23 | ||||
| 2025-07-17 | 13F | Wagner Wealth Management, Llc | 68 | 1.49 | 2 | 0.00 | ||||
| 2025-08-12 | 13F | Atlas Capital Advisors Llc | 21,176 | 196.42 | 562 | 195.26 | ||||
| 2025-07-07 | 13F | Versant Capital Management, Inc | 1,090 | 1.02 | 29 | 0.00 | ||||
| 2025-08-04 | 13F | Spire Wealth Management | 1,375 | -16.62 | 36 | -16.28 | ||||
| 2025-08-07 | 13F | Fagan Associates, Inc. | 18,821 | -1.30 | 499 | -1.77 | ||||
| 2025-08-12 | 13F | Steward Partners Investment Advisory, Llc | 2,300 | 0.00 | 61 | 0.00 | ||||
| 2025-07-31 | 13F | Whipplewood Advisors, LLC | 29,483 | 524.51 | 782 | 2.49 | ||||
| 2025-08-14 | 13F | Goldman Sachs Group Inc | 47,334 | 142.39 | 1,256 | 140.88 | ||||
| 2025-08-19 | 13F | Cape Investment Advisory, Inc. | 40 | 0.00 | 1 | 0.00 | ||||
| 2025-08-14 | 13F | Royal Bank Of Canada | 228,542 | -9.16 | 6,063 | -9.67 | ||||
| 2025-05-14 | 13F | Renaissance Technologies Llc | 0 | -100.00 | 0 | |||||
| 2025-07-25 | 13F | Hobbs Group Advisors, LLC | 170,650 | 34.18 | 4,527 | 33.42 | ||||
| 2025-07-21 | 13F | Exchange Capital Management, Inc. | 0 | -100.00 | 0 | |||||
| 2025-07-25 | 13F | Richardson Financial Services Inc. | 261 | -32.38 | 7 | -40.00 | ||||
| 2025-08-13 | 13F | Guggenheim Capital Llc | 246,847 | 10.97 | 6,549 | 10.35 | ||||
| 2025-08-01 | 13F | Signature Wealth Management Group | 78,800 | 4.42 | 2,091 | 3.83 | ||||
| 2025-07-31 | 13F | Cambridge Investment Research Advisors, Inc. | 65,137 | 13.08 | 2 | 0.00 | ||||
| 2025-08-14 | 13F | Hilltop Holdings Inc. | 28,181 | 22.84 | 748 | 22.06 | ||||
| 2025-07-29 | 13F | Ballast, Inc. | 14,840 | 394 | ||||||
| 2025-05-12 | 13F | SOUTH STATE Corp | 0 | -100.00 | 0 | |||||
| 2025-08-14 | 13F | Toroso Investments, LLC | 42,818 | 1,136 | ||||||
| 2025-07-17 | 13F | Eagle Bluffs Wealth Management LLC | 44,611 | -12.06 | 1,184 | -12.56 | ||||
| 2025-05-12 | 13F | Waterloo Capital, L.P. | 0 | -100.00 | 0 | |||||
| 2025-08-05 | 13F | Sigma Planning Corp | 0 | -100.00 | 0 | |||||
| 2025-08-14 | 13F | New England Asset Management Inc | 200 | 0.00 | 5 | 0.00 | ||||
| 2025-08-06 | 13F | First Horizon Advisors, Inc. | 0 | -100.00 | 0 | |||||
| 2025-08-13 | 13F | Millington Financial Advisors, LLC | 15,413 | 17.29 | 406 | 19.47 | ||||
| 2025-08-14 | 13F | Ancora Advisors, LLC | 1,500 | 0.00 | 40 | -2.50 | ||||
| 2025-08-14 | 13F | Stifel Financial Corp | 196,609 | -2.25 | 5,216 | -2.80 | ||||
| 2025-07-22 | 13F | DAVENPORT & Co LLC | 16,485 | 437 | ||||||
| 2025-08-06 | 13F | AE Wealth Management LLC | 141 | -79.91 | 4 | -83.33 | ||||
| 2025-08-14 | 13F | Bank Of America Corp /de/ | 1,101,433 | 1.33 | 29,221 | 0.77 | ||||
| 2025-08-12 | 13F | Lionshead Wealth Management, LLC | 8,193 | -1.99 | 217 | -2.69 | ||||
| 2025-04-22 | 13F/A | NorthRock Partners, LLC | 0 | -100.00 | 0 | -100.00 | ||||
| 2025-08-13 | 13F | Northwestern Mutual Wealth Management Co | 274,268 | 3.04 | 7,276 | 2.46 | ||||
| 2025-08-05 | 13F | Bank Of Montreal /can/ | 735,554 | 4.95 | 19,514 | 4.36 | ||||
| 2025-08-05 | 13F | Strategic Financial Concepts, LLC | 0 | -100.00 | 0 | |||||
| 2025-08-04 | 13F | Joseph P. Lucia & Associates, LLC | 14,840 | -6.71 | 394 | -7.31 | ||||
| 2025-08-14 | 13F | Ameriprise Financial Inc | 1,210,388 | 3.53 | 32,114 | 2.94 | ||||
| 2025-08-08 | 13F | Creative Planning | 8,093 | 215 | ||||||
| 2025-07-11 | 13F | Grove Bank & Trust | 700 | 0.00 | 19 | 0.00 | ||||
| 2025-07-18 | 13F | Consolidated Portfolio Review Corp | 10,967 | -2.23 | 291 | -3.01 | ||||
| 2025-08-15 | 13F | Chapman Financial Group, Llc | 1,600 | -40.74 | 42 | -40.00 | ||||
| 2025-08-12 | 13F | Horizon Financial Services, Llc | 7,009 | 64.45 | 186 | 63.72 | ||||
| 2025-07-23 | 13F | Lakeshore Capital Group, Inc. | 123,505 | -0.26 | 3,277 | -0.82 | ||||
| 2025-08-13 | 13F | Summit Financial, LLC | 8,474 | 225 | ||||||
| 2025-08-14 | 13F | Mercer Global Advisors Inc /adv | 22,545 | 598 | ||||||
| 2025-07-28 | 13F | Axxcess Wealth Management, Llc | 14,679 | 0.60 | 389 | 0.00 | ||||
| 2025-08-06 | 13F | Maltin Wealth Management, Inc. | 259,337 | 10.15 | 6,880 | 9.54 | ||||
| 2025-08-15 | 13F | Tower Research Capital LLC (TRC) | 46 | 283.33 | 1 | |||||
| 2025-08-01 | 13F | Envestnet Asset Management Inc | 765,010 | -8.66 | 20,296 | -9.17 | ||||
| 2025-08-05 | 13F | Huntington National Bank | 334 | -0.30 | ||||||
| 2025-08-13 | 13F | Invesco Ltd. | 244,987 | -1.12 | 6,500 | -1.68 | ||||
| 2025-08-14 | 13F | Fmr Llc | 429 | 464.47 | 11 | 450.00 | ||||
| 2025-07-24 | 13F | Gilliland Jeter Wealth Management LLC | 9,604 | -0.60 | 255 | -1.17 | ||||
| 2025-07-11 | 13F/A | Umb Bank N A/mo | 11,574 | 0.71 | 307 | 0.33 | ||||
| 2025-07-30 | 13F | Cullen/frost Bankers, Inc. | 17,071 | 8.06 | 453 | 7.36 | ||||
| 2025-07-17 | 13F | KG&L Capital Management,LLC | 70,765 | 2.88 | 1,877 | 2.29 | ||||
| 2025-07-17 | 13F | White Pine Investment CO | 0 | -100.00 | 0 | |||||
| 2025-07-09 | 13F | Massmutual Trust Co Fsb/adv | 17,751 | -33.12 | 471 | -33.62 | ||||
| 2025-08-01 | 13F | Petra Financial Advisors Inc | 54,503 | -2.23 | 1,446 | -2.82 | ||||
| 2025-08-12 | 13F | MAI Capital Management | 1,370 | 0.00 | 36 | 0.00 | ||||
| 2025-07-29 | 13F | Progressive Investment Management Corp | 13,796 | 2.15 | 366 | 1.67 | ||||
| 2025-07-16 | 13F | FORM Wealth Advisors, LLC | 9,752 | 1.03 | 259 | 0.39 | ||||
| 2025-08-18 | 13F | Front Row Advisors LLC | 950 | 0.00 | 25 | 0.00 | ||||
| 2025-07-25 | 13F | Astoria Portfolio Advisors LLC. | 98,626 | 4.70 | 2,594 | 5.06 | ||||
| 2025-08-11 | 13F | NewEdge Wealth, LLC | 203,271 | 7.08 | 5,427 | 7.17 | ||||
| 2025-07-30 | 13F | Eqis Capital Management, Inc. | 171,698 | -6.57 | 4,555 | -7.08 | ||||
| 2025-08-08 | 13F | Kingsview Wealth Management, LLC | 340,868 | 4.06 | 9,043 | 3.48 | ||||
| 2025-08-12 | 13F | LPL Financial LLC | 388,146 | -28.28 | 10,298 | -28.68 | ||||
| 2025-07-18 | 13F | QTR Family Wealth, LLC | 14,192 | -0.58 | 377 | -1.05 |