Statistik Asas
| Pemilik Institusi | 181 total, 177 long only, 1 short only, 3 long/short - change of -1.62% MRQ |
| Purata Peruntukan Portfolio | 0.2492 % - change of -20.45% MRQ |
| Saham Institusi (Panjang) | 5,371,898 (ex 13D/G) - change of -0.55MM shares -9.22% MRQ |
| Nilai Institusi (Panjang) | $ 751,676 USD ($1000) |
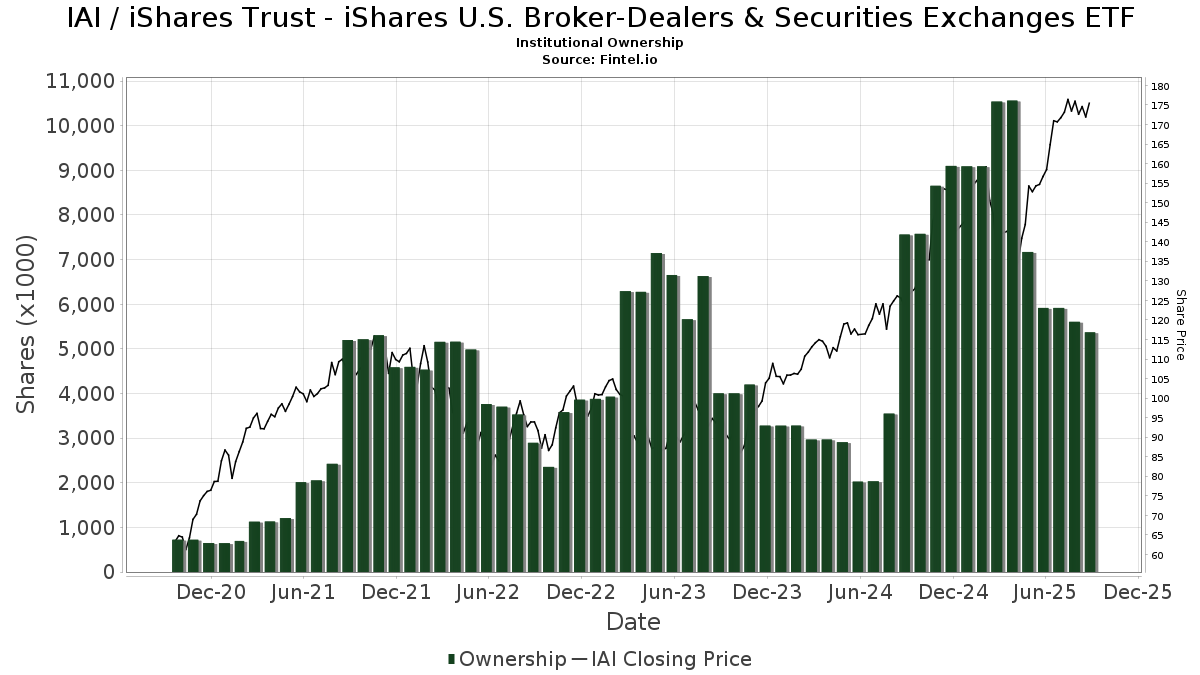
Pemilikan Institusi dan Pemegang Saham
iShares Trust - iShares U.S. Broker-Dealers & Securities Exchanges ETF (US:IAI) telah 181 pemilik institusi dan pemegang saham yang telah memfailkan borang 13D/G atau 13F dengan Suruhanjaya Bursa Sekuriti (SEC). Institusi ini memegang sejumlah 5,371,898 saham. Pemegang saham terbesar termasuk Fisher Asset Management, LLC, Harel Insurance Investments & Financial Services Ltd., Morgan Stanley, LPL Financial LLC, Bank Of America Corp /de/, Advisor Group Holdings, Inc., Mml Investors Services, Llc, Two Sigma Investments, Lp, SPC Financial, Inc., and Wells Fargo & Company/mn .
iShares Trust - iShares U.S. Broker-Dealers & Securities Exchanges ETF (ARCA:IAI) struktur pemilikan institusi menunjukkan kedudukan semasa dalam syarikat mengikut institusi dan dana serta perubahan terkini dalam saiz kedudukan. Pemegang saham utama boleh termasuk pelabur individu, dana amanah, dana lindung nilai atau institusi. Jadual 13D menunjukkan bahawa pelabur memegang (atau menahan) lebih daripada 5% syarikat dan berhasrat (atau berniat) untuk secara aktif meneruskan perubahan dalam strategi perniagaan. Jadual 13G menunjukkan pelaburan pasif melebihi 5%.
The share price as of September 5, 2025 is 170.73 / share. Previously, on September 9, 2024, the share price was 124.53 / share. This represents an increase of 37.10% over that period.
Skor Sentimen Dana
Skor Sentimen Dana (Skor Pengumpulan Pemilikan fka) mencari saham yang paling banyak dibeli oleh dana. Ia adalah hasil daripada model kuantitatif pelbagai faktor yang canggih yang mengenal pasti syarikat dengan tahap pengumpulan institusi tertinggi. Model pemarkahan ini menggunakan gabungan jumlah kenaikan dalam pemilik yang didedahkan, perubahan dalam peruntukan portfolio dalam pemilik tersebut dan metrik lain. Nombornya berjulat dari 0 hingga 100, dengan nombor yang lebih tinggi menunjukkan tahap pengumpulan yang lebih tinggi kepada rakannya, dan 50 adalah nombor purata.
Kekerapan Kemas Kini: Harian
Lihat Peneroka Pemilikan yang menyediakan senarai syarikat yang mempunyai kedudukan tertinggi.
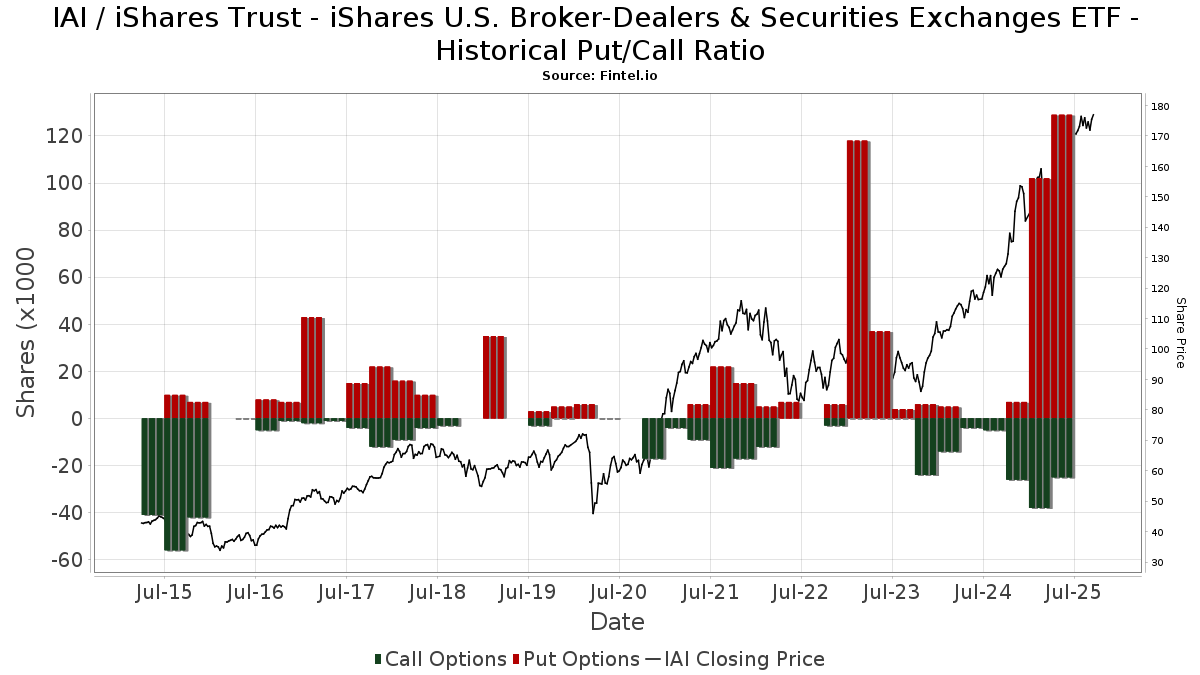
Nisbah Put/Call Institusi
Selain melaporkan isu ekuiti dan hutang standard, institusi yang mempunyai lebih daripada 100MM aset di bawah pengurusan juga mesti mendedahkan pegangan opsyen jual dan beli mereka. Memandangkan opsyen jual secara amnya menunjukkan sentimen negatif, dan opsyen beli menunjukkan sentimen positif, kita boleh mendapatkan gambaran keseluruhan sentimen institusi dengan merencanakan nisbah jual kepada beli. Carta di sebelah kanan memplotkan nisbah jual/beli sejarah untuk instrumen ini.
Menggunakan Nisbah Put/Callsebagai penunjuk sentimen pelabur mengatasi salah satu kekurangan utama menggunakan jumlah pemilikan institusi, iaitu sejumlah besar aset di bawah pengurusan dilaburkan secara pasif untuk menjejaki indeks. Dana yang diurus secara pasif biasanya tidak membeli opsyen, jadi penunjuk nisbah put/call mengekori rapat sentimen dana yang diurus secara aktif.
Pemfailan 13D/G
Kami membentangkan pemfailan 13D/G secara berasingan daripada pemfailan 13F kerana layanan yang berbeza oleh SEC. Pemfailan 13D/G boleh difailkan oleh kumpulan pelabur (dengan satu peneraju), manakala pemfailan 13F tidak boleh. Ini mengakibatkan situasi di mana pelabur yang boleh memfailkan 13D/G melaporkan satu nilai untuk jumlah saham (mewakili semua saham yang dimiliki oleh kumpulan pelabur), tetapi kemudian memfailkan 13F dengan melaporkan nilai yang berbeza untuk jumlah saham (mewakili sepenuhnya saham mereka sendiri. pemilikan). Ini bermakna pemilikan saham pemfailan 13D/G dan pemfailan 13F selalunya tidak dapat dibandingkan secara langsung, jadi kami membentangkannya secara berasingan.
Nota: Mulai 16 Mei 2021, kami tidak lagi menunjukkan pemilik yang tidak memfailkan 13D/G pada tahun lepas. Sebelum ini, kami telah menunjukkan sejarah penuh pemfailan 13D/G. Secara umum, entiti yang dikehendaki memfailkan pemfailan 13D/G mesti memfailkan sekurang-kurangnya setiap tahun sebelum menyerahkan pemfailan penutup. Walau bagaimanapun, dana kadangkala keluar dari jawatan tanpa menyerahkan pemfailan penutup (iaitu, ia ditamatkan), jadi memaparkan sejarah penuh kadangkala boleh mengakibatkan kekeliruan tentang pemilikan semasa. Untuk mengelakkan kekeliruan, kini kami hanya menunjukkan pemilik "semasa" - iaitu - pemilik yang telah memfailkan pada tahun lepas.
Upgrade to unlock premium data.
| Tarikh Fail | Borang | Pelabur | Saham Terdahulu |
Saham Terkini |
ΔSaham (Peratus) |
Pemilikan (Peratus) |
ΔPemilikan (Peratus) |
|
|---|---|---|---|---|---|---|---|---|
| 2025-04-28 | TRUIST FINANCIAL CORP | 722,350 | 14,294 | -98.02 | 0.20 | -96.55 |
Pemfailan 13F dan NPORT
Butiran mengenai pemfailan 13F adalah percuma. Perincian mengenai pemfailan NP memerlukan keahlian premium. Baris hijau menunjukkan kedudukan baharu. Baris merah menunjukkan kedudukan tertutup. Klik pautan ikon untuk melihat sejarah transaksi penuh.
Naik Taraf
untuk membuka data premium dan mengeksport ke Excel ![]() .
.
| Tarikh Fail | Sumber | Pelabur | Jenis | Purata Harga (Ang) |
Saham | ΔSaham (%) |
Nilai Dilaporkan ($1000) |
Δ Nilai (%) |
Peruntukan Port (%) |
|
|---|---|---|---|---|---|---|---|---|---|---|
| 2025-07-14 | 13F | Sowell Financial Services LLC | 1,464 | 248 | ||||||
| 2025-07-10 | 13F | Global Financial Private Client, LLC | 4,728 | 30.39 | 800 | 57.28 | ||||
| 2025-08-14 | 13F | Chicago Wealth Management, Inc. | 78,408 | -0.94 | 13,262 | 19.59 | ||||
| 2025-07-28 | 13F | Axxcess Wealth Management, Llc | 1,335 | 226 | ||||||
| 2025-07-14 | 13F | Park Avenue Securities Llc | 3,735 | 8.86 | 1 | |||||
| 2025-08-01 | 13F | Envestnet Asset Management Inc | 103,508 | -19.47 | 17,507 | -2.79 | ||||
| 2025-08-14 | 13F | GWM Advisors LLC | 4,899 | 0.04 | 829 | 20.70 | ||||
| 2025-08-14 | 13F | Tudor Financial Inc. | 18,426 | -2.25 | 3,117 | 17.99 | ||||
| 2025-08-04 | 13F | Assetmark, Inc | 6,588 | -98.85 | 1,114 | -98.62 | ||||
| 2025-08-27 | NP | XNAV - FundX Aggressive ETF | 0 | -100.00 | 0 | -100.00 | ||||
| 2025-08-14 | 13F | D. E. Shaw & Co., Inc. | 4,029 | -70.87 | 681 | -64.84 | ||||
| 2025-08-13 | 13F | Walleye Capital LLC | 3,934 | 665 | ||||||
| 2025-08-13 | 13F | EverSource Wealth Advisors, LLC | 39 | 0.00 | 7 | 20.00 | ||||
| 2025-08-14 | 13F | Two Sigma Securities, Llc | 0 | -100.00 | 0 | |||||
| 2025-08-14 | 13F | Synovus Financial Corp | 7,826 | 0.18 | 1,324 | 21.02 | ||||
| 2025-05-01 | 13F | Stephens Inc /ar/ | 0 | -100.00 | 0 | |||||
| 2025-06-17 | 13F | Howe & Rusling Inc | 0 | -100.00 | 0 | |||||
| 2025-07-15 | 13F | North Star Investment Management Corp. | 1,645 | -5.57 | 278 | 13.93 | ||||
| 2025-08-05 | 13F | Sigma Planning Corp | 2,291 | -0.35 | 387 | 20.19 | ||||
| 2025-08-04 | 13F | Balentine LLC | 443 | 0.00 | 75 | 19.35 | ||||
| 2025-08-06 | 13F | Black Swift Group, LLC | 0 | -100.00 | 0 | |||||
| 2025-08-11 | 13F | Private Advisor Group, LLC | 1,934 | 327 | ||||||
| 2025-08-05 | 13F | Bank of New York Mellon Corp | 2,076 | -0.38 | 351 | 20.62 | ||||
| 2025-08-15 | 13F | Kestra Advisory Services, LLC | 2,934 | 13.41 | 496 | 37.02 | ||||
| 2025-07-22 | 13F | DAVENPORT & Co LLC | 4,629 | -47.87 | 783 | -37.14 | ||||
| 2025-09-04 | 13F/A | Advisor Group Holdings, Inc. | 209,877 | 127.40 | 32,362 | 150.25 | ||||
| 2025-08-12 | 13F | Steward Partners Investment Advisory, Llc | 28,543 | 3.19 | 4,828 | 24.57 | ||||
| 2025-05-22 | 13F | Wbi Investments, Inc. | 0 | -100.00 | 0 | |||||
| 2025-08-04 | 13F | IFG Advisory, LLC | 7,101 | 377.86 | 1,201 | 477.40 | ||||
| 2025-08-14 | 13F | Stifel Financial Corp | 108,458 | 7.32 | 18,349 | 29.57 | ||||
| 2025-07-21 | 13F | Ascent Group, LLC | 0 | -100.00 | 0 | |||||
| 2025-07-25 | 13F | Envestnet Portfolio Solutions, Inc. | 2,213 | -60.51 | 374 | -52.36 | ||||
| 2025-08-13 | 13F | Russell Investments Group, Ltd. | 113 | 0.00 | 19 | 26.67 | ||||
| 2025-07-23 | 13F | Ignite Planners, LLC | 0 | -100.00 | 0 | |||||
| 2025-08-15 | 13F | Tower Research Capital LLC (TRC) | 0 | -100.00 | 0 | |||||
| 2025-05-15 | 13F | Hilltop Holdings Inc. | 0 | -100.00 | 0 | |||||
| 2025-08-08 | 13F | Woodley Farra Manion Portfolio Management Inc | 1,578 | 2.33 | 267 | 23.15 | ||||
| 2025-08-14 | 13F | Prelude Capital Management, Llc | 0 | -100.00 | 0 | |||||
| 2025-04-02 | 13F | Marcum Wealth, LLC | 0 | -100.00 | 0 | |||||
| 2025-07-25 | 13F | Muirfield Wealth Advisors Llc | 4,026 | -11.01 | 681 | 7.42 | ||||
| 2025-07-30 | 13F | WESPAC Advisors SoCal, LLC | 98,247 | -0.23 | 16,617 | 20.44 | ||||
| 2025-07-23 | 13F | WestEnd Advisors, LLC | 527 | -89.88 | 89 | -87.79 | ||||
| 2025-08-14 | 13F | Hrt Financial Lp | 0 | -100.00 | 0 | |||||
| 2025-08-05 | 13F | Bank Of Montreal /can/ | 12 | 0.00 | 2 | 100.00 | ||||
| 2025-08-26 | NP | CRTOX - Conquer Risk Tactical Opportunities Fund | 60,114 | -1.50 | 10,168 | 15.61 | ||||
| 2025-08-01 | 13F | Rossby Financial, LCC | 272 | 0.00 | 46 | 24.32 | ||||
| 2025-08-14 | 13F | Glen Eagle Advisors, LLC | 2,125 | 0.00 | 359 | 20.88 | ||||
| 2025-07-31 | 13F | Cambridge Investment Research Advisors, Inc. | 3,202 | 45.61 | 1 | |||||
| 2025-07-23 | 13F | WESPAC Advisors, LLC | 1,663 | 0.00 | 281 | 20.60 | ||||
| 2025-08-11 | 13F | HighTower Advisors, LLC | Put | 0 | -100.00 | 0 | ||||
| 2025-08-14 | 13F | CIBC World Markets Inc. | 2,209 | 374 | ||||||
| 2025-08-12 | 13F | Claudia M.p. Batlle, Crp (r) Llc | 0 | -100.00 | 0 | |||||
| 2025-07-15 | 13F | EWG Elevate Inc. | 0 | -100.00 | 0 | |||||
| 2025-08-11 | 13F | HighTower Advisors, LLC | Call | 0 | -100.00 | 0 | -100.00 | |||
| 2025-04-29 | 13F | Pensionmark Financial Group, Llc | 0 | -100.00 | 0 | |||||
| 2025-07-16 | 13F | Minichmacgregor Wealth Management, Llc | 64,187 | 25.60 | 10,857 | 51.62 | ||||
| 2025-08-04 | 13F | Bristlecone Advisors, LLC | 550 | 0.00 | 93 | 20.78 | ||||
| 2025-07-09 | 13F | Massmutual Trust Co Fsb/adv | 44 | 7 | ||||||
| 2025-08-11 | 13F | HHM Wealth Advisors, LLC | 77 | 0.00 | 13 | 30.00 | ||||
| 2025-08-19 | 13F | Advisory Services Network, LLC | 84,695 | 3.46 | 14,876 | 29.70 | ||||
| 2025-08-19 | 13F | Anchor Investment Management, LLC | 81 | 0.00 | 14 | 18.18 | ||||
| 2025-07-15 | 13F | Well Done, LLC | 37,230 | -0.96 | 6,297 | 16.27 | ||||
| 2025-08-07 | 13F | Allworth Financial LP | 6,620 | -12.28 | 1,120 | 7.29 | ||||
| 2025-08-06 | 13F | Commonwealth Equity Services, Llc | 6,265 | 32.76 | 1 | |||||
| 2025-08-11 | 13F | SFI Advisors, LLC | 40,485 | -6.55 | 6,848 | 12.82 | ||||
| 2025-08-14 | 13F | Federation des caisses Desjardins du Quebec | 100 | 0.00 | 17 | 14.29 | ||||
| 2025-08-13 | 13F | Pinkerton Retirement Specialists, LLC | 0 | -100.00 | 0 | |||||
| 2025-08-14 | 13F | Mariner, LLC | 19,769 | 13.08 | 3,344 | 36.50 | ||||
| 2025-05-15 | 13F | Schonfeld Strategic Advisors LLC | 0 | -100.00 | 0 | |||||
| 2025-07-17 | 13F | Paradigm Financial Partners, Llc | 6,932 | 1,172 | ||||||
| 2025-07-17 | 13F | Janney Montgomery Scott LLC | 27,847 | -40.14 | 5 | -33.33 | ||||
| 2025-07-10 | 13F | Wealth Enhancement Advisory Services, Llc | 1,631 | 280 | ||||||
| 2025-05-14 | 13F | Caitlin John, LLC | 0 | -100.00 | 0 | |||||
| 2025-07-16 | 13F | Southern Capital Advisors, Llc | 3,644 | -3.37 | 616 | 16.67 | ||||
| 2025-04-29 | 13F | Lee Danner & Bass Inc | 0 | -100.00 | 0 | -100.00 | ||||
| 2025-05-09 | 13F | Legacy Capital Group California, Inc. | 0 | -100.00 | 0 | |||||
| 2025-08-12 | 13F | O'shaughnessy Asset Management, Llc | 1,154 | -6.33 | 195 | 13.37 | ||||
| 2025-08-13 | 13F | Navis Wealth Advisors, LLC | 2,500 | 0.00 | 423 | 20.57 | ||||
| 2025-07-16 | 13F/A | CX Institutional | 1,039 | -24.87 | 0 | |||||
| 2025-07-28 | 13F | Harbour Investments, Inc. | 393 | 0.00 | 66 | 20.00 | ||||
| 2025-07-24 | 13F | Us Bancorp \de\ | 200 | 0.00 | 34 | 17.86 | ||||
| 2025-08-12 | 13F | Proequities, Inc. | 0 | 0 | ||||||
| 2025-07-15 | 13F | Heritage Oak Wealth Advisors Llc | 14,932 | 0.43 | 2,526 | 21.22 | ||||
| 2025-07-23 | 13F | Kingswood Wealth Advisors, Llc | 1,410 | -34.39 | 238 | -20.93 | ||||
| 2025-08-29 | 13F | Centaurus Financial, Inc. | 1,802 | 30.39 | 0 | |||||
| 2025-05-13 | 13F | Adviser Investments LLC | 0 | -100.00 | 0 | |||||
| 2025-04-16 | 13F | RMR Wealth Builders | 0 | -100.00 | 0 | |||||
| 2025-07-31 | 13F | Glass Jacobson Investment Advisors llc | 20 | 0.00 | 3 | 50.00 | ||||
| 2025-07-25 | 13F | Prostatis Group LLC | 0 | -100.00 | 0 | |||||
| 2025-08-12 | 13F | Founders Financial Alliance, LLC | 234 | 0.43 | 40 | 21.88 | ||||
| 2025-08-14 | 13F | Sunbelt Securities, Inc. | 293 | 614.63 | 42 | 740.00 | ||||
| 2025-07-14 | 13F | Abound Wealth Management | 32 | 0.00 | 5 | 25.00 | ||||
| 2025-08-05 | 13F | Huntington National Bank | 0 | -100.00 | ||||||
| 2025-08-13 | 13F | Summit Financial, LLC | 2,321 | -1.44 | 393 | 19.15 | ||||
| 2025-08-14 | 13F | Wiley Bros.-aintree Capital, Llc | 8,492 | -1.66 | 1,436 | 19.37 | ||||
| 2025-04-09 | 13F | Harbor Investment Advisory, Llc | 0 | -100.00 | 0 | |||||
| 2025-08-18 | 13F | Wolverine Trading, Llc | Call | 2,200 | -73.49 | 367 | -68.37 | |||
| 2025-07-31 | 13F | Hanlon Investment Management, Inc. | 0 | -100.00 | 0 | |||||
| 2025-08-18 | 13F | Wolverine Trading, Llc | Put | 7,500 | 97.37 | 1,250 | 136.29 | |||
| 2025-05-14 | 13F | Eqis Capital Management, Inc. | 0 | -100.00 | 0 | -100.00 | ||||
| 2025-08-18 | 13F | Wolverine Trading, Llc | 4,052 | 675 | ||||||
| 2025-07-24 | 13F | Blair William & Co/il | 348 | 840.54 | 59 | 1,060.00 | ||||
| 2025-08-12 | 13F | SRS Capital Advisors, Inc. | 156 | 0.00 | 26 | 23.81 | ||||
| 2025-08-12 | 13F | MAI Capital Management | 17 | 0.00 | 3 | 0.00 | ||||
| 2025-07-29 | 13F | Swmg, Llc | 1,440 | 252 | ||||||
| 2025-08-14 | 13F | Ausdal Financial Partners, Inc. | 1,449 | 245 | ||||||
| 2025-08-06 | 13F | Founders Financial Securities Llc | 27,562 | 4,662 | ||||||
| 2025-08-14 | 13F | Wells Fargo & Company/mn | 158,936 | -3.98 | 26,882 | 15.92 | ||||
| 2025-08-12 | 13F | Integrated Advisors Network LLC | 1,195 | 202 | ||||||
| 2025-08-14 | 13F | Fmr Llc | 3,963 | 2.01 | 670 | 23.16 | ||||
| 2025-08-08 | 13F | Altfest L J & Co Inc | 0 | -100.00 | 0 | |||||
| 2025-07-24 | 13F | Eastern Bank | 880 | 0.00 | 149 | 20.33 | ||||
| 2025-08-08 | 13F | Hartland & Co., LLC | 138 | 0.73 | 23 | 21.05 | ||||
| 2025-07-17 | 13F | Halbert Hargrove Global Advisors, Llc | 74 | 0.00 | 13 | 20.00 | ||||
| 2025-07-25 | 13F | Genesee Capital Advisors, LLC | 9,389 | 59.16 | 1,588 | 92.25 | ||||
| 2025-08-14 | 13F | Ameriprise Financial Inc | 118,858 | -26.62 | 20,098 | -11.43 | ||||
| 2025-07-18 | 13F | McGuire Investment Group, LLC | 31,550 | 0.01 | 5,336 | 20.75 | ||||
| 2025-08-14 | 13F | Citadel Advisors Llc | 26,693 | -26.80 | 4,515 | -11.65 | ||||
| 2025-08-14 | 13F | Citadel Advisors Llc | Put | 3,100 | 63.16 | 524 | 96.99 | |||
| 2025-08-04 | 13F | Atria Investments Llc | 7,545 | -25.86 | 1,276 | -10.46 | ||||
| 2025-07-25 | 13F | Atria Wealth Solutions, Inc. | 17,571 | -30.29 | 2,972 | -15.83 | ||||
| 2025-08-06 | 13F | Prospera Financial Services Inc | 61,258 | -0.84 | 10,361 | 19.71 | ||||
| 2025-07-02 | 13F | HBW Advisory Services LLC | 2,968 | -9.92 | 502 | 8.89 | ||||
| 2025-07-21 | 13F | Jackson Wealth Management, LLC | 5,089 | 2.17 | 861 | 23.35 | ||||
| 2025-08-14 | 13F | Mml Investors Services, Llc | 204,235 | 36.78 | 35 | 70.00 | ||||
| 2025-08-14 | 13F | Citadel Advisors Llc | Call | 5,700 | 235.29 | 964 | 305.04 | |||
| 2025-08-13 | 13F | VestGen Advisors, LLC | 16,684 | 10.70 | 2,822 | 33.63 | ||||
| 2025-08-14 | 13F | Arete Wealth Advisors, LLC | 13,712 | 581.85 | 2 | |||||
| 2025-08-14 | 13F | Royal Bank Of Canada | 90,140 | -0.20 | 15,247 | 20.48 | ||||
| 2025-08-14 | 13F | Integrated Wealth Concepts LLC | 4,102 | 694 | ||||||
| 2025-04-28 | 13F | First Horizon Advisors, Inc. | 0 | -100.00 | 0 | -100.00 | ||||
| 2025-08-13 | 13F | Quadrature Capital Ltd | 0 | -100.00 | 0 | |||||
| 2025-08-14 | 13F | UBS Group AG | 80,710 | 14.56 | 13,651 | 38.29 | ||||
| 2025-08-12 | 13F | Resolute Wealth Strategies, LLC | 1,892 | -17.77 | 320 | -0.62 | ||||
| 2025-07-02 | 13F | Central Pacific Bank - Trust Division | 30 | 0.00 | 5 | 25.00 | ||||
| 2025-08-11 | 13F | Aptus Capital Advisors, LLC | 22 | 0.00 | 4 | 0.00 | ||||
| 2025-08-15 | 13F | Equitable Holdings, Inc. | 5,367 | 185.33 | 908 | 244.87 | ||||
| 2025-07-07 | 13F | Thurston, Springer, Miller, Herd & Titak, Inc. | 294 | 0.00 | 50 | 19.51 | ||||
| 2025-08-14 | 13F | KKM Financial LLC | 1,479 | -26.12 | 250 | -10.71 | ||||
| 2025-08-14 | 13F | First International Bank of Israel Ltd. | 3,060 | 518 | ||||||
| 2025-04-10 | 13F | Secure Asset Management, LLC | 0 | -100.00 | 0 | -100.00 | ||||
| 2025-08-13 | 13F | Whalerock Point Partners, Llc | 1,227 | 208 | ||||||
| 2025-04-23 | 13F | Phillips Wealth Planners LLC | 0 | -100.00 | 0 | |||||
| 2025-07-16 | 13F | Cadent Capital Advisors, LLC | 27,637 | 80.21 | 4,675 | 117.60 | ||||
| 2025-07-24 | 13F | IFP Advisors, Inc | 263 | 39.15 | 44 | 69.23 | ||||
| 2025-08-14 | 13F | Peapack Gladstone Financial Corp | 1,200 | 0 | ||||||
| 2025-08-14 | 13F | Fwl Investment Management, Llc | 560 | 95 | ||||||
| 2025-08-15 | 13F | Morgan Stanley | 461,962 | -1.77 | 78,136 | 18.59 | ||||
| 2025-08-14 | 13F | Bank Of America Corp /de/ | 312,309 | 75.53 | 52,824 | 111.89 | ||||
| 2025-08-13 | 13F | Lido Advisors, LLC | 4,700 | -2.97 | 795 | 17.26 | ||||
| 2025-04-29 | 13F | Concurrent Investment Advisors, LLC | 0 | -100.00 | 0 | |||||
| 2025-05-09 | 13F | CoreCap Advisors, LLC | 0 | -100.00 | 0 | |||||
| 2025-08-01 | 13F | Belvedere Trading LLC | Put | 22,100 | 3,738 | |||||
| 2025-08-05 | 13F | Kesler, Norman & Wride, LLC | 2,945 | 3.55 | 498 | 25.13 | ||||
| 2025-08-14 | 13F | Peak6 Llc | Call | 0 | -100.00 | 0 | ||||
| 2025-07-22 | 13F | Wealthcare Advisory Partners LLC | 1,476 | -60.82 | 250 | -52.75 | ||||
| 2025-08-07 | 13F | David R. Rahn & Associates Inc. | 0 | -100.00 | 0 | |||||
| 2025-08-14 | 13F | Raymond James Financial Inc | 76,156 | -25.08 | 12,881 | -9.56 | ||||
| 2025-07-17 | 13F | Fifth Third Securities, Inc. | 5,917 | -10.57 | 1,001 | 7.99 | ||||
| 2025-07-28 | 13F | Duncker Streett & Co Inc | 48 | 0.00 | 8 | 33.33 | ||||
| 2025-08-14 | 13F | Jane Street Group, Llc | 0 | -100.00 | 0 | |||||
| 2025-07-31 | 13F | Brinker Capital Investments, LLC | 0 | -100.00 | 0 | -100.00 | ||||
| 2025-07-29 | 13F | Cottonwood Capital Advisors, Llc | 19,512 | -0.95 | 3,300 | 19.57 | ||||
| 2025-08-13 | 13F | Jones Financial Companies Lllp | 8,564 | 22.06 | 1,427 | 45.91 | ||||
| 2025-07-15 | 13F | Affinity Wealth Management Llc | 0 | -100.00 | 0 | |||||
| 2025-08-13 | 13F | National Bank Of Canada /fi/ | 0 | -100.00 | 0 | |||||
| 2025-07-28 | 13F | Alpine Woods Capital Investors, Llc | 3,000 | 0.00 | 507 | 20.71 | ||||
| 2025-04-24 | 13F | Transcend Wealth Collective, Llc | 0 | -100.00 | 0 | |||||
| 2025-08-08 | 13F | Cetera Investment Advisers | 33,134 | -12.00 | 5,604 | 6.24 | ||||
| 2025-08-12 | 13F | Jpmorgan Chase & Co | 2,551 | -54.00 | 431 | -44.53 | ||||
| 2025-08-06 | 13F | Csenge Advisory Group | 10,119 | -0.64 | 1,564 | 16.21 | ||||
| 2025-07-25 | 13F | Cwm, Llc | 90 | 109.30 | 0 | |||||
| 2025-05-09 | 13F | GeoWealth Management, LLC | 0 | -100.00 | 0 | |||||
| 2025-05-15 | 13F | Warren Averett Asset Management, LLC | 0 | -100.00 | 0 | |||||
| 2025-08-05 | 13F | Simplex Trading, Llc | 1,012 | 0 | ||||||
| 2025-08-14 | 13F | Clark Capital Management Group, Inc. | 20,313 | -10.74 | 3,436 | 7.75 | ||||
| 2025-08-11 | 13F | Cornerstone Planning Group LLC | 76 | 0.00 | 13 | 30.00 | ||||
| 2025-04-10 | 13F | CPR Investments Inc. | 0 | -100.00 | 0 | |||||
| 2025-07-22 | 13F | Belpointe Asset Management LLC | 7,832 | -3.00 | 1,325 | 17.06 | ||||
| 2025-09-03 | 13F | Q3 Asset Management | 3,252 | 1 | ||||||
| 2025-08-11 | 13F | HighTower Advisors, LLC | 42,303 | 9.47 | 7,155 | 32.16 | ||||
| 2025-08-11 | 13F | One Capital Management, LLC | 0 | -100.00 | 0 | |||||
| 2025-08-11 | 13F | Citigroup Inc | 2,639 | 97.68 | 446 | 138.50 | ||||
| 2025-08-13 | 13F | Baird Financial Group, Inc. | 7,809 | -0.61 | 1,321 | 20.00 | ||||
| 2025-08-12 | 13F | CIBC Private Wealth Group, LLC | 359 | -26.73 | 61 | 1.69 | ||||
| 2025-08-13 | 13F | Baker Avenue Asset Management, LP | 15,094 | 3.31 | 2,553 | 24.67 | ||||
| 2025-07-18 | 13F | Hudson Value Partners, LLC | 4,446 | -0.98 | 752 | 19.40 | ||||
| 2025-08-11 | 13F | Principal Securities, Inc. | 2,276 | -12.86 | 385 | 2.39 | ||||
| 2025-08-13 | 13F | Northwestern Mutual Wealth Management Co | 904 | -11.20 | 153 | 7.04 | ||||
| 2025-08-05 | 13F | Harel Insurance Investments & Financial Services Ltd. | 640,000 | 0.00 | 108 | 21.35 | ||||
| 2025-07-29 | 13F | Private Trust Co Na | 507 | 299.21 | 86 | 400.00 | ||||
| 2025-08-08 | 13F | Pnc Financial Services Group, Inc. | 652 | -0.46 | 110 | 20.88 | ||||
| 2025-08-04 | 13F | Integrity Alliance, Llc. | 0 | -100.00 | 0 | |||||
| 2025-08-14 | 13F | Bnp Paribas Arbitrage, Sa | 0 | -100.00 | 0 | |||||
| 2025-05-16 | 13F/A | Atlanta Consulting Group Advisors, LLC | 0 | -100.00 | 0 | |||||
| 2025-08-13 | 13F/A | StoneX Group Inc. | 2,844 | 52.82 | 284 | 38.54 | ||||
| 2025-08-13 | 13F | Great Diamond Partners, LLC | 15,109 | -4.69 | 2,556 | 15.04 | ||||
| 2025-08-13 | 13F | Millstone Evans Group, LLC | 14 | 0.00 | 2 | 100.00 | ||||
| 2025-05-08 | 13F | BRYN MAWR TRUST Co | 0 | -100.00 | 0 | |||||
| 2025-07-25 | 13F | SPC Financial, Inc. | 168,858 | -0.50 | 28,561 | 20.11 | ||||
| 2025-07-29 | 13F | Robinson Value Management, Ltd. | 9,047 | 0.00 | 1,530 | 20.76 | ||||
| 2025-05-12 | 13F | SOUTH STATE Corp | 0 | -100.00 | 0 | |||||
| 2025-07-11 | 13F | Farther Finance Advisors, LLC | 1,188 | 1,700.00 | 201 | 2,122.22 | ||||
| 2025-08-08 | 13F | Capital Investment Advisory Services, LLC | 6 | -88.68 | 1 | -85.71 | ||||
| 2025-08-14 | 13F | Susquehanna International Group, Llp | 31,508 | 21.69 | 5,329 | 46.93 | ||||
| 2025-07-10 | 13F | Focus Financial Network, Inc. | 1,449 | 245 | ||||||
| 2025-07-09 | 13F | Client First Investment Management LLC | 4,677 | 791 | ||||||
| 2025-08-14 | 13F | Susquehanna International Group, Llp | Call | 17,800 | -12.75 | 3,011 | 5.32 | |||
| 2025-08-14 | 13F | Susquehanna International Group, Llp | Put | 96,900 | 0.21 | 16,390 | 20.97 | |||
| 2025-08-19 | 13F | Newbridge Financial Services Group, Inc. | 100 | 17 | ||||||
| 2025-07-17 | 13F | Wagner Wealth Management, Llc | 141 | 24 | ||||||
| 2025-07-24 | 13F | Game Plan Financial Advisors, LLC | 100 | 0.00 | 17 | 14.29 | ||||
| 2025-08-06 | 13F | AE Wealth Management LLC | 191 | 141.77 | 32 | 190.91 | ||||
| 2025-05-16 | 13F/A | Kestra Investment Management, LLC | 0 | -100.00 | 0 | |||||
| 2025-08-01 | 13F | Chilton Capital Management Llc | 0 | -100.00 | 0 | |||||
| 2025-07-15 | 13F | Ballentine Partners, LLC | 1,300 | 220 | ||||||
| 2025-08-14 | 13F | Aprio Wealth Management, LLC | 5,481 | -4.98 | 927 | 14.60 | ||||
| 2025-07-16 | 13F | Signaturefd, Llc | 201 | 20,000.00 | 34 | |||||
| 2025-08-13 | 13F | Flow Traders U.s. Llc | 0 | -100.00 | 0 | |||||
| 2025-08-14 | 13F | Goldman Sachs Group Inc | 0 | -100.00 | 0 | |||||
| 2025-08-11 | 13F | TD Waterhouse Canada Inc. | 189 | 26.00 | 32 | 47.62 | ||||
| 2025-08-14 | 13F | Qube Research & Technologies Ltd | 31,343 | 58.00 | 5,301 | 90.75 | ||||
| 2025-08-14 | 13F | Two Sigma Investments, Lp | 202,400 | 2.79 | 34,234 | 24.09 | ||||
| 2025-08-12 | 13F | LPL Financial LLC | 374,163 | 236.84 | 63,286 | 306.64 | ||||
| 2025-08-14 | 13F | Coastal Bridge Advisors, LLC | 1,189 | -18.23 | 201 | -0.99 | ||||
| 2025-07-18 | 13F | Truist Financial Corp | 12,049 | -15.71 | 2,038 | 1.80 | ||||
| 2025-08-08 | 13F | Glassman Wealth Services | 0 | -100.00 | 0 | |||||
| 2025-08-11 | 13F | ARS Investment Partners, LLC | 15,917 | 2,692 | ||||||
| 2025-07-25 | 13F | Hazlett, Burt & Watson, Inc. | 126 | 0.00 | 0 | |||||
| 2025-07-30 | 13F | Strategic Blueprint, LLC | 1,513 | 4.78 | 256 | 26.24 | ||||
| 2025-08-13 | 13F | Renaissance Technologies Llc | 2,600 | 440 | ||||||
| 2025-05-01 | 13F | Fulcrum Equity Management | 0 | -100.00 | 0 | |||||
| 2025-08-14 | 13F | Harwood Advisory Group, LLC | 9 | 2 | ||||||
| 2025-07-23 | 13F | 1 North Wealth Services Llc | 19,391 | -1.01 | 3,280 | 19.50 | ||||
| 2025-07-11 | 13F | Seacrest Wealth Management, Llc | 2,494 | -5.03 | 422 | 14.71 | ||||
| 2025-08-14 | 13F | Family Management Corp | 10 | 0.00 | 2 | 0.00 | ||||
| 2025-08-04 | 13F | Spire Wealth Management | 352 | -5.88 | 60 | 13.46 | ||||
| 2025-08-13 | 13F | Fisher Asset Management, LLC | 684,053 | -3.68 | 115,701 | 16.28 | ||||
| 2025-08-14 | 13F | Barometer Capital Management Inc. | 3,100 | 524 | ||||||
| 2025-08-07 | 13F | Apeiron RIA LLC | 5,578 | 1.97 | 943 | 23.11 | ||||
| 2025-08-11 | 13F | Beaumont Capital Management, LLC | 0 | -100.00 | 0 | |||||
| 2025-04-24 | 13F | Total Wealth Planning & Management, Inc. | 0 | -100.00 | 0 | |||||
| 2025-08-12 | 13F | Trexquant Investment LP | 0 | -100.00 | 0 | |||||
| 2025-08-08 | 13F | Gts Securities Llc | 0 | -100.00 | 0 | |||||
| 2025-08-12 | 13F | Global Retirement Partners, LLC | 909 | 100.66 | 154 | 135.38 | ||||
| 2025-08-12 | 13F | BlackRock, Inc. | 414 | 0.73 | 70 | 22.81 | ||||
| 2025-07-15 | 13F | Fifth Third Bancorp | 288 | 0.00 | 49 | 20.00 | ||||
| 2025-08-14 | 13F | Comerica Bank | 57 | -48.18 | 10 | -40.00 | ||||
| 2025-07-17 | 13F | Lee Johnson Capital Management, Llc | 10,452 | 1,768 | ||||||
| 2025-05-02 | 13F | Cullen/frost Bankers, Inc. | 0 | -100.00 | 0 | |||||
| 2025-08-14 | 13F | Great Valley Advisor Group, Inc. | 12,048 | -1.77 | 2,038 | 18.57 | ||||
| 2025-04-21 | 13F | Harrell Investment Partners, Llc | 0 | -100.00 | 0 | |||||
| 2025-05-02 | 13F | Victory Capital Management Inc | 0 | -100.00 | 0 | -100.00 | ||||
| 2025-05-07 | 13F | Evermay Wealth Management Llc | 0 | -100.00 | 0 | -100.00 | ||||
| 2025-07-17 | 13F | Janney Capital Management LLC | 3,208 | -0.03 | 1 |
Other Listings
| MX:IAI |