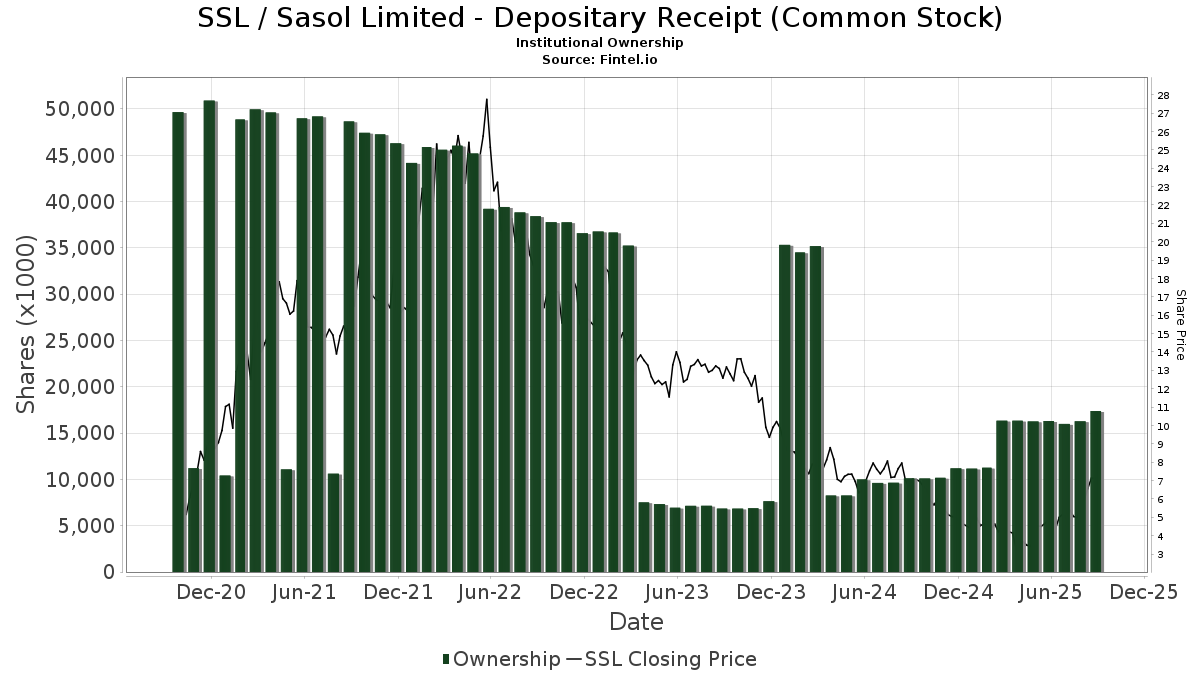
Statistik Asas
| Pemilik Institusi | 112 total, 108 long only, 0 short only, 4 long/short - change of 0.00% MRQ |
| Purata Peruntukan Portfolio | 0.0202 % - change of -21.07% MRQ |
| Saham Institusi (Panjang) | 17,382,945 (ex 13D/G) - change of 1.08MM shares 6.61% MRQ |
| Nilai Institusi (Panjang) | $ 75,419 USD ($1000) |
Pemilikan Institusi dan Pemegang Saham
Sasol Limited - Depositary Receipt (Common Stock) (US:SSL) telah 112 pemilik institusi dan pemegang saham yang telah memfailkan borang 13D/G atau 13F dengan Suruhanjaya Bursa Sekuriti (SEC). Institusi ini memegang sejumlah 17,382,945 saham. Pemegang saham terbesar termasuk Morgan Stanley, BlackRock, Inc., Two Sigma Investments, Lp, Two Sigma Advisers, Lp, American Century Companies Inc, Goldman Sachs Group Inc, Connor, Clark & Lunn Investment Management Ltd., AVEM - Avantis Emerging Markets Equity ETF, Dimensional Fund Advisors Lp, and UBS Group AG .
Sasol Limited - Depositary Receipt (Common Stock) (NYSE:SSL) struktur pemilikan institusi menunjukkan kedudukan semasa dalam syarikat mengikut institusi dan dana serta perubahan terkini dalam saiz kedudukan. Pemegang saham utama boleh termasuk pelabur individu, dana amanah, dana lindung nilai atau institusi. Jadual 13D menunjukkan bahawa pelabur memegang (atau menahan) lebih daripada 5% syarikat dan berhasrat (atau berniat) untuk secara aktif meneruskan perubahan dalam strategi perniagaan. Jadual 13G menunjukkan pelaburan pasif melebihi 5%.
The share price as of September 5, 2025 is 7.09 / share. Previously, on September 6, 2024, the share price was 7.17 / share. This represents a decline of 1.12% over that period.
Skor Sentimen Dana
Skor Sentimen Dana (Skor Pengumpulan Pemilikan fka) mencari saham yang paling banyak dibeli oleh dana. Ia adalah hasil daripada model kuantitatif pelbagai faktor yang canggih yang mengenal pasti syarikat dengan tahap pengumpulan institusi tertinggi. Model pemarkahan ini menggunakan gabungan jumlah kenaikan dalam pemilik yang didedahkan, perubahan dalam peruntukan portfolio dalam pemilik tersebut dan metrik lain. Nombornya berjulat dari 0 hingga 100, dengan nombor yang lebih tinggi menunjukkan tahap pengumpulan yang lebih tinggi kepada rakannya, dan 50 adalah nombor purata.
Kekerapan Kemas Kini: Harian
Lihat Peneroka Pemilikan yang menyediakan senarai syarikat yang mempunyai kedudukan tertinggi.
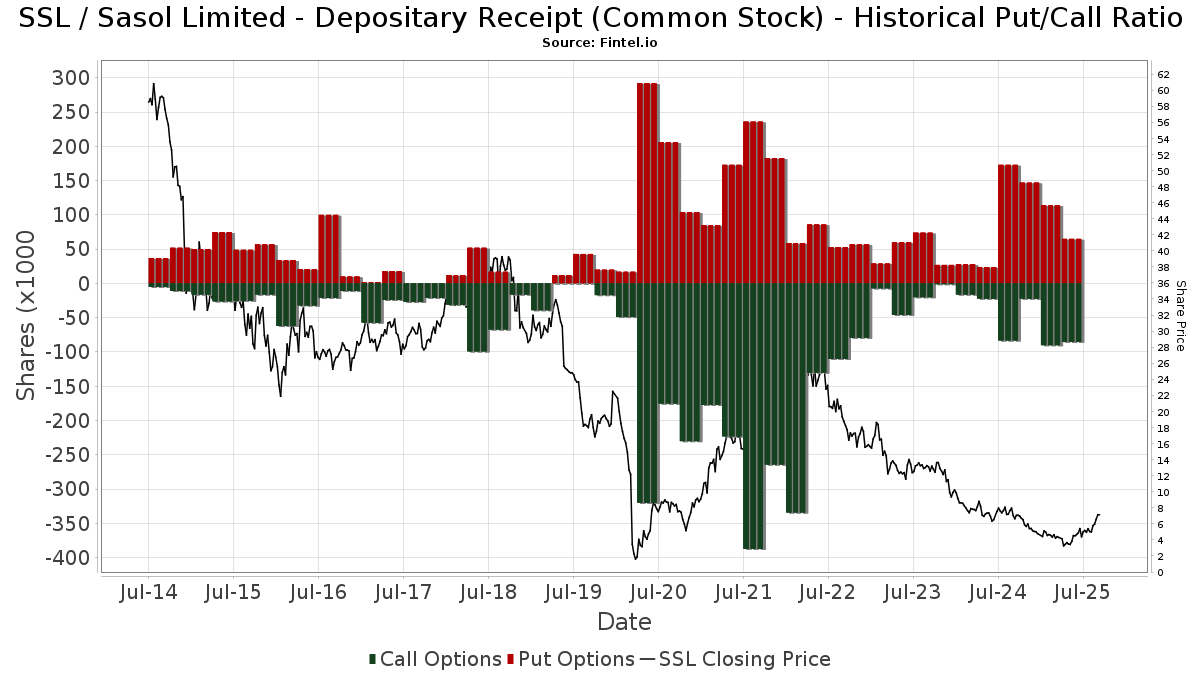
Nisbah Put/Call Institusi
Selain melaporkan isu ekuiti dan hutang standard, institusi yang mempunyai lebih daripada 100MM aset di bawah pengurusan juga mesti mendedahkan pegangan opsyen jual dan beli mereka. Memandangkan opsyen jual secara amnya menunjukkan sentimen negatif, dan opsyen beli menunjukkan sentimen positif, kita boleh mendapatkan gambaran keseluruhan sentimen institusi dengan merencanakan nisbah jual kepada beli. Carta di sebelah kanan memplotkan nisbah jual/beli sejarah untuk instrumen ini.
Menggunakan Nisbah Put/Callsebagai penunjuk sentimen pelabur mengatasi salah satu kekurangan utama menggunakan jumlah pemilikan institusi, iaitu sejumlah besar aset di bawah pengurusan dilaburkan secara pasif untuk menjejaki indeks. Dana yang diurus secara pasif biasanya tidak membeli opsyen, jadi penunjuk nisbah put/call mengekori rapat sentimen dana yang diurus secara aktif.
Pemfailan 13F dan NPORT
Butiran mengenai pemfailan 13F adalah percuma. Perincian mengenai pemfailan NP memerlukan keahlian premium. Baris hijau menunjukkan kedudukan baharu. Baris merah menunjukkan kedudukan tertutup. Klik pautan ikon untuk melihat sejarah transaksi penuh.
Naik Taraf
untuk membuka data premium dan mengeksport ke Excel ![]() .
.
| Tarikh Fail | Sumber | Pelabur | Jenis | Purata Harga (Ang) |
Saham | ΔSaham (%) |
Nilai Dilaporkan ($1000) |
Δ Nilai (%) |
Peruntukan Port (%) |
|
|---|---|---|---|---|---|---|---|---|---|---|
| 2025-07-28 | NP | AVEEX - Avantis Emerging Markets Equity Fund Institutional Class This fund is a listed as child fund of American Century Companies Inc and if that institution has disclosed ownership in this security, then these positions will not be double counted when calculating total shares and total value | 26,634 | 0.00 | 118 | 1.72 | ||||
| 2025-06-26 | NP | DFA INVESTMENT DIMENSIONS GROUP INC - World ex U.S. Core Equity Portfolio Institutional Class Shares | 20,702 | 0.00 | 72 | -25.77 | ||||
| 2025-08-06 | 13F | Savant Capital, LLC | 36,116 | 160 | ||||||
| 2025-08-14 | 13F | Raymond James Financial Inc | 9,484 | -20.33 | 42 | -18.00 | ||||
| 2025-07-08 | 13F | Parallel Advisors, LLC | 17,169 | 119.86 | 76 | 127.27 | ||||
| 2025-08-08 | 13F | Abc Arbitrage Sa | 188,436 | 833 | ||||||
| 2025-08-14 | 13F | Evergreen Capital Management Llc | 23,166 | 102 | ||||||
| 2025-05-05 | 13F | Lindbrook Capital, Llc | 3,168 | -55.96 | 13 | -59.37 | ||||
| 2025-08-14 | 13F | UBS Group AG | 631,731 | -14.31 | 2,792 | -10.46 | ||||
| 2025-08-12 | 13F | XTX Topco Ltd | 0 | -100.00 | 0 | |||||
| 2025-08-13 | 13F | Guggenheim Capital Llc | 19,861 | -5.68 | 88 | -2.25 | ||||
| 2025-04-30 | 13F | Nisa Investment Advisors, Llc | 0 | -100.00 | 0 | |||||
| 2025-08-14 | 13F | Royal Bank Of Canada | 15,936 | -8.13 | 71 | -2.74 | ||||
| 2025-05-15 | 13F | Pinnacle Wealth Planning Services, Inc. | 0 | -100.00 | 0 | |||||
| 2025-08-12 | 13F | Jpmorgan Chase & Co | 59,395 | 7,081.98 | 263 | 8,633.33 | ||||
| 2025-07-25 | 13F | Cwm, Llc | 1,727 | -69.44 | 0 | |||||
| 2025-08-14 | 13F | Two Sigma Securities, Llc | 0 | -100.00 | 0 | |||||
| 2025-07-28 | NP | AVEM - Avantis Emerging Markets Equity ETF This fund is a listed as child fund of American Century Companies Inc and if that institution has disclosed ownership in this security, then these positions will not be double counted when calculating total shares and total value | 735,074 | 26.23 | 3,264 | 28.26 | ||||
| 2025-08-14 | 13F | Bnp Paribas Arbitrage, Sa | 221,995 | 210.48 | 981 | 224.83 | ||||
| 2025-08-08 | 13F | SG Americas Securities, LLC | 76,763 | 0 | ||||||
| 2025-05-08 | 13F | Essential Planning, LLC. | 0 | -100.00 | 0 | |||||
| 2025-08-12 | 13F | Pacer Advisors, Inc. | 142,633 | 128.96 | 635 | 144.79 | ||||
| 2025-08-14 | 13F | Bank Of America Corp /de/ | 537,250 | 206.17 | 2,375 | 219.95 | ||||
| 2025-08-15 | 13F | CI Private Wealth, LLC | 20,740 | -31.20 | 92 | -28.35 | ||||
| 2025-07-14 | 13F | UMA Financial Services, Inc. | 211 | 37.91 | 1 | |||||
| 2025-08-12 | 13F | American Century Companies Inc | 890,502 | 25.48 | 3,936 | 31.16 | ||||
| 2025-08-12 | 13F | Dimensional Fund Advisors Lp | 724,589 | -26.13 | 3,203 | -22.79 | ||||
| 2025-08-13 | 13F | Jump Financial, LLC | 388,598 | 211.33 | 1,718 | 225.81 | ||||
| 2025-08-14 | 13F | Sunbelt Securities, Inc. | 99 | 0.00 | 0 | |||||
| 2025-07-22 | 13F | Net Worth Advisory Group | 21,611 | 5.12 | 96 | 10.47 | ||||
| 2025-04-24 | 13F | PDS Planning, Inc | 0 | -100.00 | 0 | |||||
| 2025-08-12 | 13F | Skopos Labs, Inc. | 2,184 | 0.00 | 9 | 0.00 | ||||
| 2025-08-13 | 13F | Cerity Partners LLC | 43,002 | -25.03 | 190 | -21.49 | ||||
| 2025-05-15 | 13F | Point72 Hong Kong Ltd | 0 | -100.00 | 0 | -100.00 | ||||
| 2025-08-14 | 13F | Group One Trading, L.p. | 9,426 | -47.47 | 42 | -45.33 | ||||
| 2025-08-07 | 13F | Allworth Financial LP | 3,213 | 205.71 | 14 | 366.67 | ||||
| 2025-08-14 | 13F | Mariner, LLC | 206,154 | 236.03 | 911 | 251.74 | ||||
| 2025-08-14 | 13F | Group One Trading, L.p. | Put | 7,200 | -61.08 | 32 | -60.26 | |||
| 2025-08-14 | 13F | Sei Investments Co | 0 | -100.00 | 0 | |||||
| 2025-08-14 | 13F | Group One Trading, L.p. | Call | 10,200 | 920.00 | 45 | 1,025.00 | |||
| 2025-08-15 | 13F | Morgan Stanley | 3,089,253 | 39.02 | 13,655 | 45.27 | ||||
| 2025-08-15 | 13F | Tower Research Capital LLC (TRC) | 5,566 | -46.96 | 25 | -45.45 | ||||
| 2025-08-12 | 13F | Aigen Investment Management, Lp | 0 | -100.00 | 0 | |||||
| 2025-06-26 | NP | Dfa Investment Trust Co - The Emerging Markets Series This fund is a listed as child fund of Dimensional Fund Advisors Lp and if that institution has disclosed ownership in this security, then these positions will not be double counted when calculating total shares and total value | 305,779 | -19.24 | 1,064 | -40.19 | ||||
| 2025-08-11 | 13F | Bell Investment Advisors, Inc | 70 | 0.00 | 0 | |||||
| 2025-07-21 | 13F | Qrg Capital Management, Inc. | 22,781 | 11.33 | 101 | 16.28 | ||||
| 2025-08-08 | 13F | Creative Planning | 246,324 | 157.03 | 1,089 | 168.64 | ||||
| 2025-08-14 | 13F | GWM Advisors LLC | 18,814 | 47.57 | 83 | 56.60 | ||||
| 2025-08-14 | 13F | Point72 Asset Management, L.P. | 512,500 | 23.44 | 2,265 | 28.99 | ||||
| 2025-08-14 | 13F | Wells Fargo & Company/mn | 10,533 | 37.61 | 47 | 43.75 | ||||
| 2025-08-13 | 13F | Walleye Capital LLC | 0 | -100.00 | 0 | -100.00 | ||||
| 2025-07-28 | NP | AVXC - Avantis Emerging Markets ex-China Equity ETF | 6,939 | 37.43 | 31 | 36.36 | ||||
| 2025-08-08 | 13F | SBI Securities Co., Ltd. | 12,852 | 2.87 | 57 | 7.69 | ||||
| 2025-08-14 | 13F | Millennium Management Llc | 32,510 | -97.76 | 144 | -97.67 | ||||
| 2025-05-06 | 13F | Advisors Preferred, LLC | 0 | -100.00 | 0 | |||||
| 2025-07-08 | 13F | Northwest & Ethical Investments L.P. | 0 | -100.00 | 0 | |||||
| 2025-08-13 | 13F | First Trust Advisors Lp | 14,155 | -5.15 | 63 | -1.59 | ||||
| 2025-08-07 | 13F | Connor, Clark & Lunn Investment Management Ltd. | 767,312 | 11.93 | 3,392 | 16.97 | ||||
| 2025-08-14 | 13F | Quartz Partners, LLC | 14,504 | 8.01 | 64 | 14.29 | ||||
| 2025-08-14 | 13F | Aqr Capital Management Llc | 22,987 | 102 | ||||||
| 2025-07-24 | 13F | Ronald Blue Trust, Inc. | 13,245 | -23.12 | 59 | -19.44 | ||||
| 2025-05-15 | 13F | Verition Fund Management LLC | 0 | -100.00 | 0 | -100.00 | ||||
| 2025-05-15 | 13F | Jain Global LLC | 0 | -100.00 | 0 | |||||
| 2025-08-14 | 13F | Susquehanna International Group, Llp | Put | 36,200 | -41.33 | 160 | -38.46 | |||
| 2025-08-14 | 13F | Susquehanna International Group, Llp | 11,756 | -93.96 | 52 | -93.80 | ||||
| 2025-08-12 | 13F | Coldstream Capital Management Inc | 0 | -100.00 | 0 | |||||
| 2025-08-12 | 13F | Pathstone Holdings, LLC | 31,049 | -3.90 | 137 | 0.74 | ||||
| 2025-08-14 | 13F | Susquehanna International Group, Llp | Call | 25,100 | 42.61 | 111 | 48.65 | |||
| 2025-08-12 | 13F | Proequities, Inc. | Put | 0 | 0 | |||||
| 2025-08-13 | 13F | Quadrant Capital Group Llc | 152,631 | 264.80 | 675 | 282.95 | ||||
| 2025-06-30 | NP | CAFRX - Africa Fund | 4,000 | 0.00 | 14 | -27.78 | ||||
| 2025-08-12 | 13F | Proequities, Inc. | Call | 0 | 0 | |||||
| 2025-05-05 | 13F | Creekmur Asset Management LLC | 0 | -100.00 | 0 | |||||
| 2025-08-11 | 13F | Private Advisor Group, LLC | 41,939 | 75.82 | 185 | 85.00 | ||||
| 2025-08-12 | 13F | Proequities, Inc. | 0 | 0 | ||||||
| 2025-08-08 | 13F | Gts Securities Llc | 29,088 | 129 | ||||||
| 2025-07-24 | 13F | Us Bancorp \de\ | 23,635 | 14.71 | 104 | 19.54 | ||||
| 2025-07-25 | 13F | JustInvest LLC | 34,523 | -25.37 | 153 | -22.05 | ||||
| 2025-08-12 | 13F | BlackRock, Inc. | 2,011,911 | 55.03 | 8,893 | 62.00 | ||||
| 2025-08-12 | 13F | Trexquant Investment LP | 0 | -100.00 | 0 | |||||
| 2025-07-30 | NP | APIE - ActivePassive International Equity ETF | 54,732 | 64.07 | 243 | 67.59 | ||||
| 2025-07-16 | 13F | Signaturefd, Llc | 26,790 | 137.54 | 118 | 151.06 | ||||
| 2025-08-12 | 13F | LPL Financial LLC | 129,340 | 121.80 | 572 | 132.11 | ||||
| 2025-08-13 | 13F | Centiva Capital, LP | 0 | -100.00 | 0 | |||||
| 2025-08-13 | 13F | Northern Trust Corp | 162,406 | 0.95 | 718 | 5.44 | ||||
| 2025-08-14 | 13F | Van Eck Associates Corp | 1,176 | -28.34 | 0 | |||||
| 2025-07-14 | 13F | GAMMA Investing LLC | 4,155 | 231.08 | 18 | 260.00 | ||||
| 2025-08-21 | NP | AFK - VanEck Vectors Africa Index ETF | 28,350 | -1.12 | 125 | 3.31 | ||||
| 2025-08-13 | 13F | Barclays Plc | 0 | -100.00 | 0 | |||||
| 2025-08-11 | 13F | Principal Securities, Inc. | 167 | 221.15 | 1 | |||||
| 2025-07-24 | 13F | Jfs Wealth Advisors, Llc | 271 | 1 | ||||||
| 2025-08-14 | 13F | D. E. Shaw & Co., Inc. | 202,856 | -54.32 | 897 | -52.29 | ||||
| 2025-08-14 | 13F | Ariadne Wealth Management, LP | 11,772 | 68 | ||||||
| 2025-07-28 | NP | AVES - Avantis Emerging Markets Value ETF This fund is a listed as child fund of American Century Companies Inc and if that institution has disclosed ownership in this security, then these positions will not be double counted when calculating total shares and total value | 83,985 | 14.17 | 373 | 15.89 | ||||
| 2025-08-14 | 13F | Goldman Sachs Group Inc | 862,405 | 575.68 | 3,812 | 607.05 | ||||
| 2025-08-14 | 13F | Jane Street Group, Llc | 281,722 | 82.11 | 1,245 | 90.37 | ||||
| 2025-05-02 | 13F | Pzena Investment Management Llc | 0 | -100.00 | 0 | |||||
| 2025-05-14 | 13F | EntryPoint Capital, LLC | 0 | -100.00 | 0 | |||||
| 2025-08-12 | 13F | Rhumbline Advisers | 6,235 | -9.57 | 28 | -6.90 | ||||
| 2025-05-15 | 13F | Engineers Gate Manager LP | 0 | -100.00 | 0 | |||||
| 2025-07-18 | 13F | Generali Investments CEE, investicni spolecnost, a.s. | 367,196 | 0.00 | 1,623 | 4.51 | ||||
| 2025-07-25 | 13F | Sequoia Financial Advisors, LLC | 13,875 | 8.47 | 61 | 12.96 | ||||
| 2025-08-14 | 13F | Banco BTG Pactual S.A. | 20,000 | 88 | ||||||
| 2025-08-14 | 13F | Two Sigma Investments, Lp | 1,004,589 | -33.71 | 4,440 | -30.73 | ||||
| 2025-08-14 | 13F | Wetherby Asset Management Inc | 31,130 | -0.16 | 138 | -3.52 | ||||
| 2025-08-11 | 13F | Brown Brothers Harriman & Co | 435 | 2 | ||||||
| 2025-08-14 | 13F | Vident Advisory, LLC | 59,417 | -17.00 | 263 | -13.25 | ||||
| 2025-08-13 | 13F | Renaissance Technologies Llc | 393,800 | -8.84 | 1,741 | -4.76 | ||||
| 2025-08-14 | 13F | Ieq Capital, Llc | 13,580 | 60 | ||||||
| 2025-08-06 | 13F | True Wealth Design, LLC | 43 | -15.69 | 0 | |||||
| 2025-07-15 | 13F | Public Employees Retirement System Of Ohio | 95,728 | 15.87 | 423 | 21.20 | ||||
| 2025-07-09 | 13F | Sivia Capital Partners, LLC | 11,699 | 52 | ||||||
| 2025-08-11 | 13F | Citigroup Inc | 122,476 | 138.37 | 541 | 149.31 | ||||
| 2025-05-13 | 13F | HighTower Advisors, LLC | 0 | -100.00 | 0 | |||||
| 2025-07-30 | 13F | FNY Investment Advisers, LLC | 203,310 | 1 | ||||||
| 2025-05-12 | 13F | Greenwich Wealth Management LLC | 0 | -100.00 | 0 | |||||
| 2025-08-04 | 13F | Hantz Financial Services, Inc. | 0 | -100.00 | 0 | |||||
| 2025-08-08 | 13F | Pnc Financial Services Group, Inc. | 11,518 | 0.18 | 51 | 4.17 | ||||
| 2025-08-14 | 13F | Cubist Systematic Strategies, LLC | 285,377 | 39.36 | 1,261 | 45.61 | ||||
| 2025-08-12 | 13F | Virtu Financial LLC | 27,237 | 46.78 | 0 | |||||
| 2025-08-14 | 13F | Fmr Llc | 17,956 | -57.54 | 79 | -55.62 | ||||
| 2025-06-26 | NP | DFCEX - Emerging Markets Core Equity Portfolio - Institutional Class This fund is a listed as child fund of Dimensional Fund Advisors Lp and if that institution has disclosed ownership in this security, then these positions will not be double counted when calculating total shares and total value | 508,321 | 0.00 | 1,769 | -25.99 | ||||
| 2025-07-11 | 13F | Farther Finance Advisors, LLC | 691 | 230.62 | 3 | |||||
| 2025-07-25 | 13F | Apollon Wealth Management, LLC | 0 | -100.00 | 0 | |||||
| 2025-06-02 | 13F/A | Deutsche Bank Ag\ | 0 | -100.00 | 0 | |||||
| 2025-08-13 | 13F | FORA Capital, LLC | 0 | -100.00 | 0 | |||||
| 2025-08-14 | 13F | Schonfeld Strategic Advisors LLC | 0 | -100.00 | 0 | |||||
| 2025-07-14 | 13F | Abound Wealth Management | 26 | 0.00 | 0 | |||||
| 2025-08-05 | 13F | Simplex Trading, Llc | Call | 16,600 | -57.44 | 0 | ||||
| 2025-08-14 | 13F | Banque Transatlantique SA | 0 | -100.00 | 0 | |||||
| 2025-09-04 | 13F/A | Advisor Group Holdings, Inc. | 4,839 | -14.03 | 21 | -8.70 | ||||
| 2025-07-31 | 13F | Caitong International Asset Management Co., Ltd | 997 | 100.20 | 4 | 100.00 | ||||
| 2025-08-04 | 13F | Assetmark, Inc | 101 | 0 | ||||||
| 2025-08-07 | 13F | Sierra Ocean, Llc | 1,230 | 86.08 | 5 | 150.00 | ||||
| 2025-08-05 | 13F | Simplex Trading, Llc | Put | 100 | -99.39 | 0 | ||||
| 2025-08-05 | 13F | Simplex Trading, Llc | 2,676 | -76.74 | 0 | |||||
| 2025-08-15 | 13F | WealthCollab, LLC | 0 | -100.00 | 0 | |||||
| 2025-08-07 | 13F | Parkside Financial Bank & Trust | 406 | 2 | ||||||
| 2025-08-13 | 13F | EverSource Wealth Advisors, LLC | 8,960 | 347.33 | 40 | 387.50 | ||||
| 2025-07-28 | NP | VCGEX - Emerging Economies Fund | 20,550 | -79.64 | 91 | -80.00 | ||||
| 2025-07-15 | 13F | Ballentine Partners, LLC | 19,572 | 47.28 | 87 | 53.57 | ||||
| 2025-08-14 | 13F | Citadel Advisors Llc | 85,777 | -51.42 | 379 | -49.20 | ||||
| 2025-05-30 | NP | FRDM - Freedom 100 Emerging Markets ETF | 0 | -100.00 | 0 | -100.00 | ||||
| 2025-08-14 | 13F | Citadel Advisors Llc | Put | 22,000 | 24.29 | 97 | 31.08 | |||
| 2025-08-14 | 13F | Integrated Wealth Concepts LLC | 60,514 | 267 | ||||||
| 2025-04-23 | 13F | Legacy Advisors, LLC | 0 | -100.00 | 0 | |||||
| 2025-08-12 | 13F | MAI Capital Management | 2,652 | 12 | ||||||
| 2025-08-14 | 13F | Citadel Advisors Llc | Call | 33,200 | 1.84 | 147 | 6.57 | |||
| 2025-08-14 | 13F | Stifel Financial Corp | 264,506 | 1,169 | ||||||
| 2025-05-14 | 13F | Ameriprise Financial Inc | 0 | -100.00 | 0 | -100.00 | ||||
| 2025-08-14 | 13F | Barometer Capital Management Inc. | 51,821 | 5.93 | 229 | 11.17 | ||||
| 2025-08-14 | 13F | Two Sigma Advisers, Lp | 932,800 | -25.12 | 4,123 | -21.77 | ||||
| 2025-07-21 | 13F | Ameriflex Group, Inc. | 400 | -82.61 | 2 | -88.89 | ||||
| 2025-08-14 | 13F | Federation des caisses Desjardins du Quebec | 700 | -22.22 | 3 | 0.00 | ||||
| 2025-08-14 | 13F | Balyasny Asset Management Llc | 28,262 | -51.21 | 125 | -49.39 | ||||
| 2025-08-13 | 13F | Northwestern Mutual Wealth Management Co | 1,172 | 5 | ||||||
| 2025-08-19 | 13F | Asset Dedication, LLC | 0 | -100.00 | 0 | |||||
| 2025-08-12 | 13F | O'shaughnessy Asset Management, Llc | 0 | -100.00 | 0 | |||||
| 2025-07-28 | NP | NSI - National Security Emerging Markets Index ETF | 16,514 | 38.49 | 73 | 40.38 | ||||
| 2025-07-24 | 13F | IFP Advisors, Inc | 0 | -100.00 | 0 |
Other Listings
| DE:SAO | €6.15 |