Statistik Asas
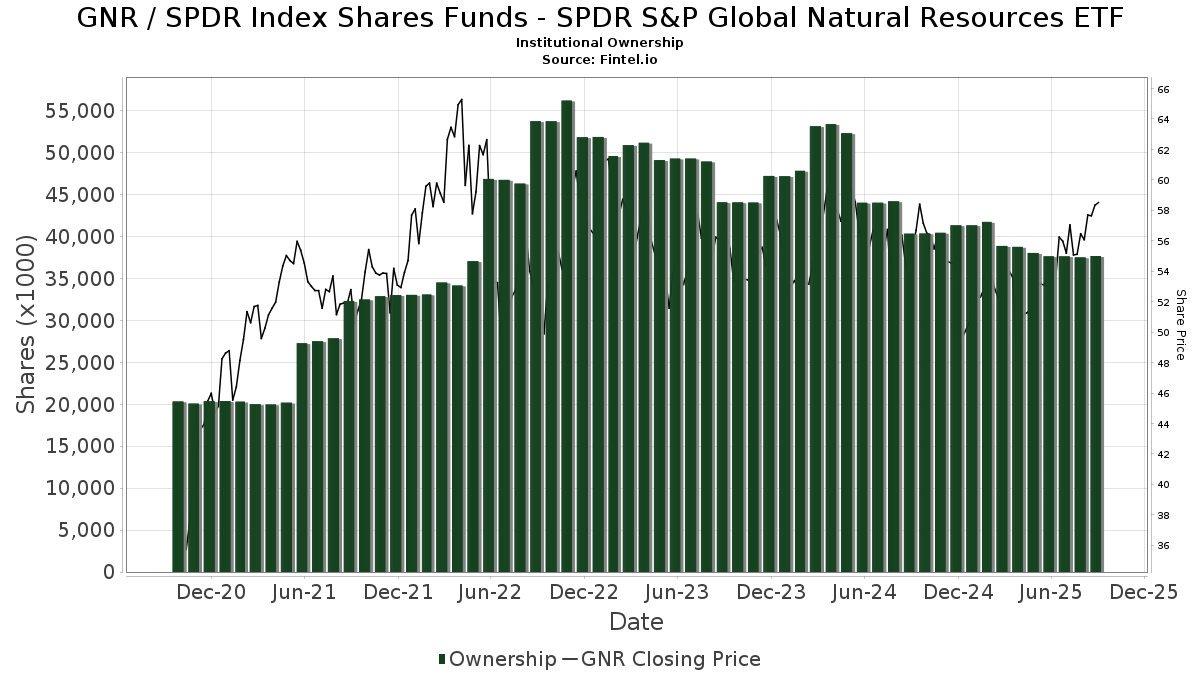
| Pemilik Institusi | 228 total, 228 long only, 0 short only, 0 long/short - change of -5.76% MRQ |
| Purata Peruntukan Portfolio | 0.7313 % - change of 15.91% MRQ |
| Saham Institusi (Panjang) | 37,786,433 (ex 13D/G) - change of 0.15MM shares 0.39% MRQ |
| Nilai Institusi (Panjang) | $ 2,019,229 USD ($1000) |
Pemilikan Institusi dan Pemegang Saham
SPDR Index Shares Funds - SPDR S&P Global Natural Resources ETF (US:GNR) telah 228 pemilik institusi dan pemegang saham yang telah memfailkan borang 13D/G atau 13F dengan Suruhanjaya Bursa Sekuriti (SEC). Institusi ini memegang sejumlah 37,786,433 saham. Pemegang saham terbesar termasuk Northern Trust Corp, Pure Financial Advisors, Inc., RLY - SPDR SSGA Multi-Asset Real Return ETF, Oxford Financial Group Ltd, Hackensack Meridian Health, Inc., Johns Hopkins University, Morgan Stanley, BlackRock, Inc., Bank Of America Corp /de/, and Nepc Llc .
SPDR Index Shares Funds - SPDR S&P Global Natural Resources ETF (ARCA:GNR) struktur pemilikan institusi menunjukkan kedudukan semasa dalam syarikat mengikut institusi dan dana serta perubahan terkini dalam saiz kedudukan. Pemegang saham utama boleh termasuk pelabur individu, dana amanah, dana lindung nilai atau institusi. Jadual 13D menunjukkan bahawa pelabur memegang (atau menahan) lebih daripada 5% syarikat dan berhasrat (atau berniat) untuk secara aktif meneruskan perubahan dalam strategi perniagaan. Jadual 13G menunjukkan pelaburan pasif melebihi 5%.
The share price as of September 5, 2025 is 57.86 / share. Previously, on September 6, 2024, the share price was 53.48 / share. This represents an increase of 8.19% over that period.
Skor Sentimen Dana
Skor Sentimen Dana (Skor Pengumpulan Pemilikan fka) mencari saham yang paling banyak dibeli oleh dana. Ia adalah hasil daripada model kuantitatif pelbagai faktor yang canggih yang mengenal pasti syarikat dengan tahap pengumpulan institusi tertinggi. Model pemarkahan ini menggunakan gabungan jumlah kenaikan dalam pemilik yang didedahkan, perubahan dalam peruntukan portfolio dalam pemilik tersebut dan metrik lain. Nombornya berjulat dari 0 hingga 100, dengan nombor yang lebih tinggi menunjukkan tahap pengumpulan yang lebih tinggi kepada rakannya, dan 50 adalah nombor purata.
Kekerapan Kemas Kini: Harian
Lihat Peneroka Pemilikan yang menyediakan senarai syarikat yang mempunyai kedudukan tertinggi.
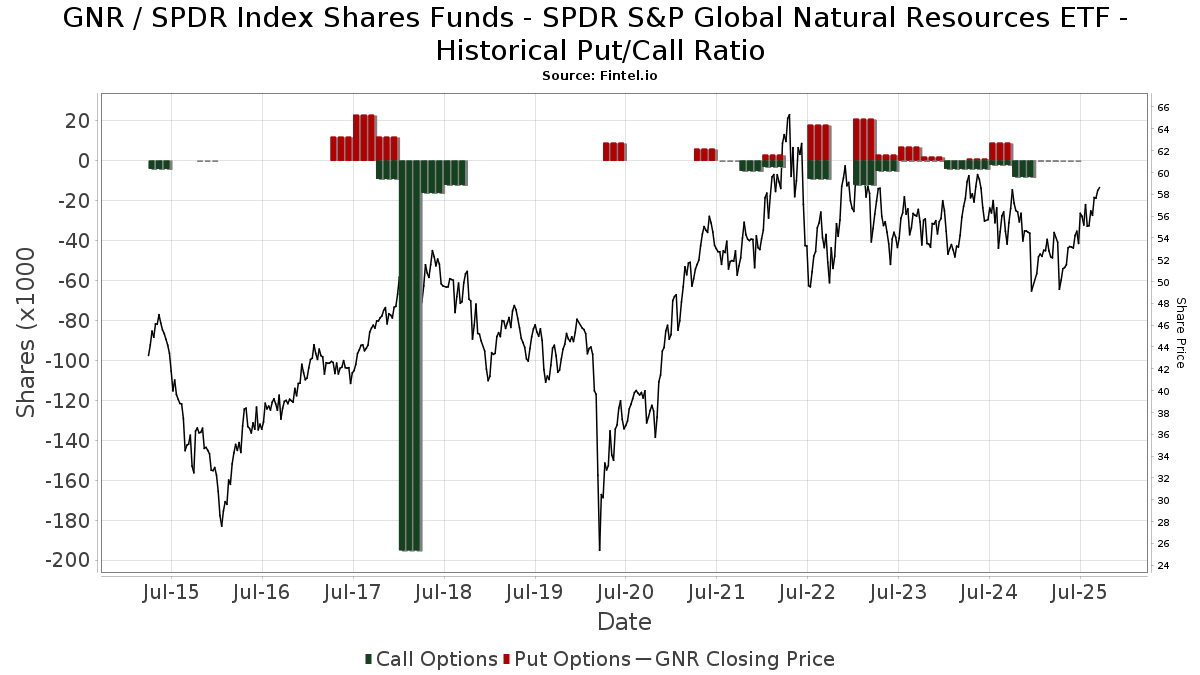
Nisbah Put/Call Institusi
Selain melaporkan isu ekuiti dan hutang standard, institusi yang mempunyai lebih daripada 100MM aset di bawah pengurusan juga mesti mendedahkan pegangan opsyen jual dan beli mereka. Memandangkan opsyen jual secara amnya menunjukkan sentimen negatif, dan opsyen beli menunjukkan sentimen positif, kita boleh mendapatkan gambaran keseluruhan sentimen institusi dengan merencanakan nisbah jual kepada beli. Carta di sebelah kanan memplotkan nisbah jual/beli sejarah untuk instrumen ini.
Menggunakan Nisbah Put/Callsebagai penunjuk sentimen pelabur mengatasi salah satu kekurangan utama menggunakan jumlah pemilikan institusi, iaitu sejumlah besar aset di bawah pengurusan dilaburkan secara pasif untuk menjejaki indeks. Dana yang diurus secara pasif biasanya tidak membeli opsyen, jadi penunjuk nisbah put/call mengekori rapat sentimen dana yang diurus secara aktif.
Pemfailan 13F dan NPORT
Butiran mengenai pemfailan 13F adalah percuma. Perincian mengenai pemfailan NP memerlukan keahlian premium. Baris hijau menunjukkan kedudukan baharu. Baris merah menunjukkan kedudukan tertutup. Klik pautan ikon untuk melihat sejarah transaksi penuh.
Naik Taraf
untuk membuka data premium dan mengeksport ke Excel ![]() .
.
| Tarikh Fail | Sumber | Pelabur | Jenis | Purata Harga (Ang) |
Saham | ΔSaham (%) |
Nilai Dilaporkan ($1000) |
Δ Nilai (%) |
Peruntukan Port (%) |
|
|---|---|---|---|---|---|---|---|---|---|---|
| 2025-07-28 | 13F | BRYN MAWR TRUST Co | 10,800 | 0.00 | 586 | 1.74 | ||||
| 2025-07-02 | 13F | Howard Financial Services, Ltd. | 0 | -100.00 | 0 | |||||
| 2025-07-10 | 13F | Sterling Investment Advisors Llc /adv | 123,462 | 5.13 | 6,697 | 7.10 | ||||
| 2025-08-14 | 13F | Boston Private Wealth Llc | 6,372 | -5.74 | 346 | -3.90 | ||||
| 2025-07-08 | 13F | Boltwood Capital Management | 46,200 | -9.17 | 2,506 | -7.50 | ||||
| 2025-05-13 | 13F | Tocqueville Asset Management L.p. | 0 | -100.00 | 0 | -100.00 | ||||
| 2025-07-28 | 13F | Harbour Investments, Inc. | 206 | 1.48 | 11 | 10.00 | ||||
| 2025-07-31 | 13F/A | Sendero Wealth Management, LLC | 362,282 | -16.20 | 19,650 | -14.64 | ||||
| 2025-07-24 | 13F | IFP Advisors, Inc | 0 | -100.00 | 0 | |||||
| 2025-08-05 | 13F | Navalign, LLC | 0 | -100.00 | 0 | |||||
| 2025-07-24 | 13F | Comprehensive Money Management Services LLC | 11,644 | 7.79 | 632 | 9.74 | ||||
| 2025-08-13 | 13F | Brooklands Fund Management Ltd | Call | 1 | 0 | |||||
| 2025-08-06 | 13F | TKG Advisors, LLC | 5,493 | 0.00 | 298 | 1.71 | ||||
| 2025-08-13 | 13F | Fort Sheridan Advisors Llc | 4,001 | -25.76 | 217 | -24.13 | ||||
| 2025-07-17 | 13F | Sage Rhino Capital Llc | 28,054 | -1.37 | 1,522 | 0.46 | ||||
| 2025-08-14 | 13F | Treasure Coast Financial Planning | 105,613 | 8.30 | 5,728 | 10.32 | ||||
| 2025-08-06 | 13F | Prospera Financial Services Inc | 6,388 | 3.48 | 347 | 5.49 | ||||
| 2025-08-18 | 13F/A | National Bank Of Canada /fi/ | 8,809 | 0.17 | 477 | 1.92 | ||||
| 2025-07-22 | 13F | White & Co Financial Planning Inc | 57,937 | 2.13 | 3,142 | 3.77 | ||||
| 2025-07-16 | 13F | Signaturefd, Llc | 100 | -65.28 | 5 | -66.67 | ||||
| 2025-08-11 | 13F | Empowered Funds, LLC | 0 | -100.00 | 0 | |||||
| 2025-08-14 | 13F | Integrated Wealth Concepts LLC | 5,932 | -3.18 | 322 | -1.53 | ||||
| 2025-08-08 | 13F | Firestone Capital Management | 17,202 | -9.99 | 933 | -8.26 | ||||
| 2025-08-14 | 13F | Stifel Financial Corp | 52,517 | 2.95 | 2,848 | 4.86 | ||||
| 2025-07-25 | 13F | Sequoia Financial Advisors, LLC | 10,839 | -0.10 | 588 | 1.73 | ||||
| 2025-07-21 | 13F | Cromwell Holdings LLC | 0 | -100.00 | 0 | |||||
| 2025-08-12 | 13F | Steward Partners Investment Advisory, Llc | 1,807 | -7.33 | 98 | -4.85 | ||||
| 2025-05-14 | 13F | Power Wealth Management Llc | 0 | -100.00 | 0 | |||||
| 2025-07-16 | 13F | One + One Wealth Management, Llc | 33,213 | -1.68 | 1,801 | 0.17 | ||||
| 2025-08-13 | 13F | 1832 Asset Management L.P. | 423,429 | -50.63 | 22,967 | -49.72 | ||||
| 2025-07-31 | 13F | Sage Mountain Advisors LLC | 13,394 | 0.00 | 726 | 1.82 | ||||
| 2025-07-11 | 13F | Essex Savings Bank | 0 | -100.00 | 0 | |||||
| 2025-08-15 | 13F | Morgan Stanley | 1,157,427 | -19.12 | 62,779 | -17.62 | ||||
| 2025-07-15 | 13F | Patriot Investment Management Inc. | 4,470 | 0.00 | 242 | 1.68 | ||||
| 2025-07-25 | 13F | Cwm, Llc | 360 | 0.00 | 0 | |||||
| 2025-08-05 | 13F | Elyxium Wealth, LLC | 0 | -100.00 | 0 | |||||
| 2025-08-14 | 13F | D. E. Shaw & Co., Inc. | 4,986 | -1.97 | 270 | 0.00 | ||||
| 2025-08-01 | 13F | Brookwood Investment Group LLC | 19,954 | 18.79 | 1,082 | 21.03 | ||||
| 2025-07-31 | 13F | Jackson Hole Capital Partners, LLC | 2,762 | 0.00 | 150 | 1.36 | ||||
| 2025-08-06 | 13F | AE Wealth Management LLC | 838 | 0.00 | 45 | 2.27 | ||||
| 2025-08-08 | 13F | Hudock, Inc. | 4,403 | 0.27 | 239 | 2.15 | ||||
| 2025-08-13 | 13F | M&t Bank Corp | 121,431 | 0.00 | 6,586 | 1.86 | ||||
| 2025-07-09 | 13F | Fermata Advisors, LLC | 10,190 | -17.95 | 553 | -16.49 | ||||
| 2025-05-13 | 13F | Ci Investments Inc. | 0 | -100.00 | 0 | |||||
| 2025-08-07 | 13F | Brio Consultants, LLC | 28,799 | 91.67 | 1,562 | 95.25 | ||||
| 2025-08-13 | 13F | Meketa Investment Group Inc /adv | 0 | -100.00 | 0 | |||||
| 2025-08-12 | 13F | Rock Creek Group, LP | 6,264 | 427 | ||||||
| 2025-04-23 | 13F | ASB Consultores, LLC | 0 | -100.00 | 0 | |||||
| 2025-08-13 | 13F | Rsm Us Wealth Management Llc | 23,090 | -1.61 | 1,252 | 0.24 | ||||
| 2025-07-17 | 13F | Worth Financial Advisory Group, LLC | 4,818 | -11.64 | 261 | -10.00 | ||||
| 2025-08-12 | 13F | Jpmorgan Chase & Co | 563,243 | -2.63 | 30,550 | -0.82 | ||||
| 2025-08-14 | 13F | Snowden Capital Advisors LLC | 7,671 | -21.64 | 416 | -20.15 | ||||
| 2025-07-15 | 13F | GSB Wealth Management, LLC | 125 | 9.65 | 7 | 0.00 | ||||
| 2025-08-12 | 13F | Bokf, Na | 0 | -100.00 | 0 | |||||
| 2025-08-14 | 13F | Sunbelt Securities, Inc. | 0 | -100.00 | 0 | |||||
| 2025-08-06 | 13F | Atlantic Union Bankshares Corp | 402 | 22 | ||||||
| 2025-08-08 | 13F | Gts Securities Llc | 0 | -100.00 | 0 | |||||
| 2025-07-09 | 13F | Reyes Financial Architecture, Inc. | 342 | 19 | ||||||
| 2025-07-01 | 13F | Harbor Investment Advisory, Llc | 40 | -86.71 | 2 | -87.50 | ||||
| 2025-07-16 | 13F | Perigon Wealth Management, LLC | 21,103 | 1.03 | 1,145 | 2.88 | ||||
| 2025-07-16 | 13F/A | CX Institutional | 41 | -90.40 | 0 | |||||
| 2025-08-01 | 13F | Bessemer Group Inc | 43,291 | -51.22 | 2 | -50.00 | ||||
| 2025-08-05 | 13F | Mason Investment Advisory Services, Inc. | 11,774 | -10.35 | 639 | -8.73 | ||||
| 2025-08-07 | 13F | Allworth Financial LP | 75 | 4 | ||||||
| 2025-08-14 | 13F | Greenline Partners, LLC | 0 | -100.00 | 0 | |||||
| 2025-07-31 | 13F | FSM Wealth Advisors, LLC | 5,131 | -0.98 | 284 | 3.27 | ||||
| 2025-07-14 | 13F | AdvisorNet Financial, Inc | 1,244 | 16.15 | 67 | 17.54 | ||||
| 2025-08-14 | 13F | Aqr Capital Management Llc | 26,359 | 0.86 | 1,430 | 2.73 | ||||
| 2025-08-14 | 13F | Ameriprise Financial Inc | 116,098 | 226.37 | 6,298 | 232.47 | ||||
| 2025-08-14 | 13F | Citadel Advisors Llc | Call | 0 | -100.00 | 0 | ||||
| 2025-07-18 | 13F | Pure Financial Advisors, Inc. | 1,952,602 | 2.80 | 105,909 | 4.72 | ||||
| 2025-08-14 | 13F | Citadel Advisors Llc | Put | 0 | -100.00 | 0 | ||||
| 2025-08-13 | 13F | Baird Financial Group, Inc. | 3,817 | -56.08 | 207 | -55.19 | ||||
| 2025-08-14 | 13F | GWM Advisors LLC | 25,019 | -11.20 | 1,357 | -9.53 | ||||
| 2025-07-22 | 13F | SOL Capital Management CO | 41,020 | -1.61 | 2 | 0.00 | ||||
| 2025-07-23 | 13F | Nbt Bank N A /ny | 750 | 650.00 | 41 | 700.00 | ||||
| 2025-04-11 | 13F | City State Bank | 0 | -100.00 | 0 | |||||
| 2025-08-13 | 13F | Kayne Anderson Rudnick Investment Management Llc | 187 | 10 | ||||||
| 2025-08-14 | 13F | Mercer Global Advisors Inc /adv | 83,396 | -31.88 | 4,524 | -30.61 | ||||
| 2025-09-04 | 13F/A | Advisor Group Holdings, Inc. | 9,970 | -27.40 | 541 | -25.99 | ||||
| 2025-07-16 | 13F | Stephenson National Bank & Trust | 36,576 | -15.17 | 1,984 | -13.63 | ||||
| 2025-08-12 | 13F | Wood Tarver Financial Group, LLC | 412 | 0.00 | 0 | -100.00 | ||||
| 2025-07-25 | 13F | Pathway Financial Advisors LLC | 8,431 | -34.32 | 457 | -33.09 | ||||
| 2025-08-13 | 13F | Renaissance Technologies Llc | 4,400 | -87.85 | 239 | -87.65 | ||||
| 2025-07-22 | 13F | Global Strategic Investment Solutions, LLC | 27,389 | -7.22 | 1,486 | -5.47 | ||||
| 2025-08-13 | 13F | Townsquare Capital Llc | 0 | -100.00 | 0 | |||||
| 2025-08-11 | 13F | Aptus Capital Advisors, LLC | 355 | 1.43 | 19 | 5.56 | ||||
| 2025-08-12 | 13F | Allen Capital Group, LLC | 23,024 | -2.48 | 1,249 | -0.72 | ||||
| 2025-08-06 | 13F | Stone House Investment Management, LLC | 1,608 | -1.05 | 87 | 1.16 | ||||
| 2025-08-14 | 13F | UBS Group AG | 427,262 | 5.21 | 23,175 | 7.17 | ||||
| 2025-07-15 | 13F | Main Street Group, LTD | 2 | 0.00 | 0 | |||||
| 2025-08-14 | 13F | Operose Advisors LLC | 189 | 0.00 | 10 | 0.00 | ||||
| 2025-07-11 | 13F | Farther Finance Advisors, LLC | 3,724 | 202 | ||||||
| 2025-08-14 | 13F | CoreCap Advisors, LLC | 0 | -100.00 | 0 | |||||
| 2025-08-13 | 13F | Botty Investors LLC | 6,900 | 0.00 | 374 | 1.91 | ||||
| 2025-08-14 | 13F | Trace Wealth Advisors, LLC | 0 | -100.00 | 0 | |||||
| 2025-04-23 | 13F | Mascagni Wealth Management, Inc. | 0 | -100.00 | 0 | -100.00 | ||||
| 2025-07-08 | 13F | Parallel Advisors, LLC | 100 | 0.00 | 5 | 0.00 | ||||
| 2025-08-12 | 13F | Proequities, Inc. | 0 | 0 | ||||||
| 2025-08-13 | 13F | Flow Traders U.s. Llc | 86,380 | 5 | ||||||
| 2025-07-31 | 13F | Longview Financial Advisors, Inc. | 20,339 | -28.57 | 1,103 | -27.24 | ||||
| 2025-06-30 | 13F/A | Deutsche Bank Ag\ | 0 | -100.00 | 0 | |||||
| 2025-08-06 | 13F | Commonwealth Equity Services, Llc | 45,157 | -15.18 | 2 | 0.00 | ||||
| 2025-08-14 | 13F/A | Rockefeller Capital Management L.P. | 75,439 | 132.75 | 4,092 | 137.16 | ||||
| 2025-08-14 | 13F | Hackensack Meridian Health, Inc. | 1,606,000 | 0.00 | 87,109 | 1.86 | ||||
| 2025-08-14 | 13F | Mariner, LLC | 76,003 | 0.45 | 4,122 | 2.31 | ||||
| 2025-08-05 | 13F | Hills Bank & Trust Co | 40,485 | 2,196 | ||||||
| 2025-08-08 | 13F | Meridian Wealth Management, LLC | 4,100 | 222 | ||||||
| 2025-07-23 | 13F | Morton Capital Management LLC/CA | 10,861 | 0.53 | 589 | 2.43 | ||||
| 2025-04-22 | 13F | Duncker Streett & Co Inc | 0 | -100.00 | 0 | |||||
| 2025-08-12 | 13F | Minot DeBlois Advisors LLC | 750 | 0.00 | 41 | 2.56 | ||||
| 2025-08-12 | 13F | Kimelman & Baird, LLC | 14,500 | 0.00 | 786 | 1.81 | ||||
| 2025-08-13 | 13F | Jones Financial Companies Lllp | 3,740 | 11.21 | 203 | 12.85 | ||||
| 2025-07-31 | 13F | WFA Asset Management Corp | 493 | 1.65 | 28 | -3.57 | ||||
| 2025-04-29 | 13F | Richard Bernstein Advisors LLC | 0 | -100.00 | 0 | |||||
| 2025-07-24 | 13F | Blair William & Co/il | 4,641 | -8.33 | 252 | -6.69 | ||||
| 2025-08-01 | 13F | Envestnet Asset Management Inc | 182,197 | 0.45 | 9,882 | 2.32 | ||||
| 2025-08-12 | 13F | Charles Schwab Investment Management Inc | 347,871 | -1.91 | 18,869 | -0.09 | ||||
| 2025-04-10 | 13F | Park Edge Advisors, LLC | 0 | -100.00 | 0 | |||||
| 2025-08-13 | 13F | Millstone Evans Group, LLC | 130 | 0.00 | 7 | 16.67 | ||||
| 2025-08-14 | 13F | Visionary Wealth Advisors | 13,095 | -9.05 | 710 | -7.31 | ||||
| 2025-05-01 | 13F | Schechter Investment Advisors, LLC | 60,133 | -3.35 | 3,202 | 3.46 | ||||
| 2025-08-05 | 13F | Bank Of Montreal /can/ | 159,309 | -6.23 | 8,641 | -4.49 | ||||
| 2025-04-15 | 13F | Transform Wealth, LLC | 0 | -100.00 | 0 | |||||
| 2025-07-15 | 13F | Gunma Bank,Ltd. | 70,000 | 0.00 | 4 | 0.00 | ||||
| 2025-07-17 | 13F | Sound Income Strategies, LLC | 19 | 0.00 | 1 | 0.00 | ||||
| 2025-08-11 | 13F | Cornerstone Planning Group LLC | 526 | 1.54 | 29 | 7.69 | ||||
| 2025-08-14 | 13F | Royal Bank Of Canada | 120,316 | -20.59 | 6,525 | -19.12 | ||||
| 2025-04-17 | 13F | Monticello Wealth Management, Llc | 0 | -100.00 | 0 | |||||
| 2025-08-04 | 13F | Spire Wealth Management | 106 | 0.00 | 6 | 0.00 | ||||
| 2025-05-12 | 13F | Sandy Spring Bank | 402 | 0.00 | 21 | 5.00 | ||||
| 2025-08-13 | 13F | Northwestern Mutual Wealth Management Co | 6,882 | 33.22 | 373 | 35.64 | ||||
| 2025-07-25 | NP | PRDAX - Diversified Real Asset Fund Class A | 97,447 | 1.78 | 5,174 | 3.31 | ||||
| 2025-08-11 | 13F | NewEdge Wealth, LLC | 9,069 | 0.00 | 503 | 4.15 | ||||
| 2025-08-14 | 13F | Raymond James Financial Inc | 468,126 | 1.83 | 25,391 | 3.72 | ||||
| 2025-04-29 | 13F | U.S. Capital Wealth Advisors, LLC | 0 | -100.00 | 0 | |||||
| 2025-07-30 | 13F | Whittier Trust Co Of Nevada Inc | 216 | 0.00 | 12 | 0.00 | ||||
| 2025-08-14 | 13F | Citadel Advisors Llc | 5,517 | 14.96 | 299 | 17.25 | ||||
| 2025-07-24 | 13F | Us Bancorp \de\ | 19,017 | 0.00 | 1,031 | 1.88 | ||||
| 2025-08-01 | 13F | Redwood Park Advisors LLC | 10,873 | 5.69 | 590 | 7.68 | ||||
| 2025-08-11 | 13F | Citigroup Inc | 9,685 | 2.22 | 525 | 4.17 | ||||
| 2025-05-30 | NP | GDMA - Gadsden Dynamic Multi-Asset ETF | 115,444 | 6,147 | ||||||
| 2025-07-22 | 13F | Wealthcare Advisory Partners LLC | 25,038 | 135.16 | 1,358 | 139.93 | ||||
| 2025-08-26 | NP | PDPAX - Virtus Rampart Alternatives Diversifier Fund Class A | 49,400 | 67.74 | 2,679 | 70.85 | ||||
| 2025-08-12 | 13F | Palisades Hudson Asset Management, L.P. | 58,013 | 4.32 | 3 | 50.00 | ||||
| 2025-08-14 | 13F | Alliancebernstein L.p. | 485,649 | -0.68 | 26,342 | 1.16 | ||||
| 2025-08-19 | 13F | Newbridge Financial Services Group, Inc. | 18 | 0.00 | 1 | |||||
| 2025-08-12 | 13F | CIBC Private Wealth Group, LLC | 4,007 | -21.03 | 217 | -6.06 | ||||
| 2025-05-05 | 13F | Nwam Llc | 0 | -100.00 | 0 | |||||
| 2025-08-08 | 13F | Principal Financial Group Inc | 276,997 | 30.72 | 15,024 | 33.16 | ||||
| 2025-07-18 | 13F | Lynx Investment Advisory | 16,833 | -45.42 | 913 | -44.40 | ||||
| 2025-07-30 | 13F | Cullen/frost Bankers, Inc. | 350 | -82.93 | 19 | -83.49 | ||||
| 2025-08-14 | 13F | Fmr Llc | 370,890 | -3.27 | 20,117 | -1.46 | ||||
| 2025-07-25 | 13F | Landmark Wealth Management, LLC | 36,583 | -1.06 | 2 | 0.00 | ||||
| 2025-07-30 | 13F | Clune & Associates, Ltd. | 19,261 | -1.67 | 1,045 | 0.10 | ||||
| 2025-08-07 | 13F | Commerce Bank | 4,370 | 0.00 | 237 | 2.16 | ||||
| 2025-07-31 | 13F | Conservest Capital Advisors, Inc. | 45,736 | 14.74 | 2,481 | 16.87 | ||||
| 2025-04-15 | 13F | Signet Financial Management, Llc | 0 | -100.00 | 0 | |||||
| 2025-08-14 | 13F | Nepc Llc | 861,133 | 17.82 | 46,708 | 20.01 | ||||
| 2025-08-14 | 13F | Mml Investors Services, Llc | 11,557 | -2.23 | 1 | |||||
| 2025-07-22 | 13F | Gsa Capital Partners Llp | 0 | -100.00 | 0 | |||||
| 2025-08-13 | 13F | Schroder Investment Management Group | 39,540 | -60.50 | 2,145 | -59.87 | ||||
| 2025-08-12 | 13F | OneAscent Financial Services LLC | 16,052 | -31.09 | 1 | -100.00 | ||||
| 2025-07-23 | 13F | Valmark Advisers, Inc. | 109,402 | 23.43 | 5,934 | 25.73 | ||||
| 2025-08-13 | 13F | Satovsky Asset Management Llc | 138,051 | 2.44 | 7,488 | 4.33 | ||||
| 2025-07-28 | 13F | Mutual Advisors, LLC | 6,300 | -9.10 | 357 | -0.28 | ||||
| 2025-08-12 | 13F | LPL Financial LLC | 160,626 | -20.85 | 8,712 | -19.38 | ||||
| 2025-08-12 | 13F | MAI Capital Management | 428 | 0.00 | 23 | 4.55 | ||||
| 2025-08-14 | 13F/A | Perritt Capital Management Inc | 28,676 | 3.62 | 1,555 | 5.57 | ||||
| 2025-08-05 | 13F | Carolinas Wealth Consulting Llc | 0 | -100.00 | 0 | -100.00 | ||||
| 2025-07-31 | 13F | Money Design Co.,Ltd. | 33,051 | 17.62 | 2 | 0.00 | ||||
| 2025-08-11 | 13F | Regal Investment Advisors LLC | 48,138 | -1.86 | 2,611 | 0.00 | ||||
| 2025-08-12 | 13F | Global Retirement Partners, LLC | 0 | -100.00 | 0 | |||||
| 2025-08-12 | 13F | O'shaughnessy Asset Management, Llc | 331 | -16.83 | 18 | -19.05 | ||||
| 2025-05-09 | 13F | Frazier Financial Advisors, LLC | 0 | -100.00 | 0 | |||||
| 2025-08-04 | 13F | Hantz Financial Services, Inc. | 0 | -100.00 | 0 | |||||
| 2025-08-04 | 13F | AMG National Trust Bank | 428,714 | 11.01 | 23,253 | 13.08 | ||||
| 2025-08-14 | 13F | VPR Management LLC | 77,550 | 0.00 | 4,206 | 1.86 | ||||
| 2025-08-12 | 13F | Hanover Advisors Inc | 5,908 | -15.94 | 320 | -14.44 | ||||
| 2025-07-08 | 13F | Nbc Securities, Inc. | 29 | 0.00 | 0 | |||||
| 2025-04-15 | 13F | Corrigan Financial, Inc. | 13,641 | -10.60 | 726 | -4.35 | ||||
| 2025-05-05 | 13F | Lindbrook Capital, Llc | 0 | -100.00 | 0 | |||||
| 2025-08-04 | 13F | Assetmark, Inc | 214 | 12 | ||||||
| 2025-08-11 | 13F | von Borstel & Associates, Inc. | 0 | -100.00 | 0 | |||||
| 2025-08-04 | 13F | Mesirow Financial Investment Management, Inc. | 3,988 | 0.96 | 216 | 2.86 | ||||
| 2025-07-07 | 13F | Versant Capital Management, Inc | 167,746 | 13.55 | 9,099 | 15.66 | ||||
| 2025-05-15 | 13F | Macquarie Group Ltd | 0 | -100.00 | 0 | |||||
| 2025-07-18 | 13F | Warren Street Wealth Advisors, LLC | 172,627 | 9.52 | 9,363 | 11.56 | ||||
| 2025-08-08 | 13F | Hedeker Wealth, LLC | 12,408 | -0.92 | 673 | 1.05 | ||||
| 2025-07-23 | 13F | Litman Gregory Asset Management LLC | 6,766 | 0.00 | 367 | 1.67 | ||||
| 2025-08-13 | 13F | PACK Private Wealth, LLC | 153,853 | 7.04 | 8,345 | 9.03 | ||||
| 2025-08-14 | 13F | Susquehanna International Group, Llp | 20,131 | -2.05 | 1,092 | -0.27 | ||||
| 2025-08-14 | 13F | Wells Fargo & Company/mn | 268,304 | -2.24 | 14,553 | -0.42 | ||||
| 2025-08-13 | 13F | Nicolet Advisory Services, Llc | 0 | -100.00 | 0 | |||||
| 2025-05-06 | 13F | Venturi Wealth Management, LLC | 0 | -100.00 | 0 | |||||
| 2025-07-29 | 13F | Kanawha Capital Management Llc | 18,360 | 0.00 | 996 | 1.84 | ||||
| 2025-08-11 | 13F | HighTower Advisors, LLC | 4,372 | -38.85 | 237 | -37.63 | ||||
| 2025-08-05 | 13F | Huntington National Bank | 6 | 400.00 | ||||||
| 2025-08-28 | 13F/A | Tolleson Wealth Management, Inc. | 0 | -100.00 | 0 | -100.00 | ||||
| 2025-08-12 | 13F | BlackRock, Inc. | 1,061,645 | 0.00 | 57,584 | 1.86 | ||||
| 2025-08-18 | 13F | Geneos Wealth Management Inc. | 2,151 | -1.92 | 117 | 0.00 | ||||
| 2025-08-14 | 13F | Hurley Capital, LLC | 1,100 | 0.00 | 60 | 1.72 | ||||
| 2025-08-18 | 13F | Hollencrest Capital Management | 53 | 3 | ||||||
| 2025-07-22 | 13F | Cornerstone Partners Capital Management, Llc | 352,374 | 0.00 | 19,113 | 1.86 | ||||
| 2025-08-13 | 13F | Cresset Asset Management, LLC | 5,564 | -3.37 | 302 | -1.63 | ||||
| 2025-05-15 | 13F | Glenmede Trust Co Na | 9,503 | 91.09 | 506 | 104.86 | ||||
| 2025-07-10 | 13F | Wealth Enhancement Advisory Services, Llc | 25,164 | -2.13 | 1,412 | 3.14 | ||||
| 2025-07-24 | 13F | Trust Co Of Toledo Na /oh/ | 13 | 1 | ||||||
| 2025-05-12 | 13F | Virtu Financial LLC | 0 | -100.00 | 0 | |||||
| 2025-08-12 | 13F | Pathstone Holdings, LLC | 24,110 | 0.00 | 1,308 | 1.87 | ||||
| 2025-08-14 | 13F | Cardiff Park Advisors, Llc | 200 | 0.00 | 11 | 0.00 | ||||
| 2025-07-30 | 13F | D.a. Davidson & Co. | 59,202 | 2.53 | 3,211 | 4.46 | ||||
| 2025-08-14 | 13F | Bank Of America Corp /de/ | 966,621 | 41.69 | 52,430 | 44.32 | ||||
| 2025-08-05 | 13F | Simplex Trading, Llc | 120 | 0 | ||||||
| 2025-08-15 | 13F | Captrust Financial Advisors | 160,260 | -3.59 | 8,692 | -1.80 | ||||
| 2025-08-14 | 13F | Gotham Asset Management, LLC | 32,472 | 0.00 | 1,761 | 1.85 | ||||
| 2025-08-14 | 13F | Colony Group, LLC | 23,316 | 8.01 | 1,265 | 10.01 | ||||
| 2025-08-06 | 13F | Savant Capital, LLC | 15,052 | 816 | ||||||
| 2025-07-22 | 13F | Coastal Investment Advisors, Inc. | 0 | -100.00 | 0 | |||||
| 2025-08-08 | 13F | Creative Planning | 20,847 | 28.39 | 1,131 | 30.79 | ||||
| 2025-08-14 | 13F | Cambridge Associates Llc /ma/ /adv | 309,990 | 0.00 | 16,814 | 1.86 | ||||
| 2025-08-08 | 13F | Pnc Financial Services Group, Inc. | 7,303 | 65.26 | 396 | 68.51 | ||||
| 2025-08-14 | 13F | London & Capital Asset Management Ltd | 0 | -100.00 | 0 | |||||
| 2025-07-03 | 13F | Garde Capital, Inc. | 1,754 | 0.00 | 95 | 2.15 | ||||
| 2025-08-11 | 13F | Dorsey & Whitney Trust CO LLC | 7,506 | 6.38 | 407 | 8.53 | ||||
| 2025-07-21 | 13F | J2 Capital Management Inc | 10,330 | 3.10 | 560 | 5.07 | ||||
| 2025-08-13 | 13F | Cerity Partners LLC | 76,815 | 2.38 | 4,166 | 4.28 | ||||
| 2025-08-14 | 13F | Oxford Financial Group Ltd | 1,690,960 | 1,026.46 | 91,718 | 1,047.47 | ||||
| 2025-08-07 | 13F | Evoke Wealth, Llc | 94,974 | 13.53 | 5,151 | 15.65 | ||||
| 2025-08-13 | 13F | IAG Wealth Partners, LLC | 67,381 | -19.32 | 3,655 | -17.83 | ||||
| 2025-08-07 | 13F | 1620 Investment Advisors, Inc. | 0 | -100.00 | 0 | |||||
| 2025-08-08 | 13F | Cetera Investment Advisers | 64,979 | 4.56 | 3,524 | 6.50 | ||||
| 2025-08-12 | 13F | Calton & Associates, Inc. | 3,900 | -4.36 | 212 | -2.76 | ||||
| 2025-04-29 | 13F | Lee Danner & Bass Inc | 0 | -100.00 | 0 | -100.00 | ||||
| 2025-08-05 | 13F | Bank of New York Mellon Corp | 286,493 | -6.03 | 15,539 | -4.28 | ||||
| 2025-08-14 | 13F | Goldman Sachs Group Inc | 4,951 | 0.00 | 269 | 1.90 | ||||
| 2025-08-27 | NP | RLY - SPDR SSGA Multi-Asset Real Return ETF This fund is a listed as child fund of State Street Corp and if that institution has disclosed ownership in this security, then these positions will not be double counted when calculating total shares and total value | 1,936,968 | -5.34 | 105,061 | -3.58 | ||||
| 2025-08-12 | 13F | DiMeo Schneider & Associates, L.L.C. | 88,238 | 1.50 | 4,786 | 3.39 | ||||
| 2025-08-14 | 13F | Manufacturers Life Insurance Company, The | 39,111 | 363.84 | 2,121 | 372.38 | ||||
| 2025-07-23 | 13F | Sachetta, LLC | 203,795 | 19.48 | 11,054 | 21.70 | ||||
| 2025-07-18 | 13F | Fmb Wealth Management | 21,799 | 0.00 | 1,182 | 1.90 | ||||
| 2025-07-08 | 13F/A | Salem Investment Counselors Inc | 35 | 2 | ||||||
| 2025-08-13 | 13F | Crescent Grove Advisors, LLC | 46,808 | 3.60 | 2,539 | 5.53 | ||||
| 2025-08-15 | 13F | CI Private Wealth, LLC | 9,380 | 98.52 | 509 | 102.39 | ||||
| 2025-07-15 | 13F | Mather Group, Llc. | 5,708 | 0.00 | 310 | 1.98 | ||||
| 2025-08-12 | 13F | TCTC Holdings, LLC | 175 | 0.00 | 9 | 0.00 | ||||
| 2025-08-14 | 13F | Old Mission Capital Llc | 0 | -100.00 | 0 | |||||
| 2025-08-13 | 13F | Northern Trust Corp | 13,399,173 | -3.54 | 726,771 | -1.74 | ||||
| 2025-07-30 | 13F | Dupree Financial Group, LLC | 9,045 | -1.71 | 491 | 0.00 | ||||
| 2025-07-30 | 13F | Phillips Financial Management, Llc | 69,848 | 19.65 | 3,788 | 21.88 | ||||
| 2025-07-11 | 13F | Grove Bank & Trust | 485 | 0.00 | 26 | 4.00 | ||||
| 2025-06-25 | NP | WMMRX - Wilmington Real Asset Fund Class A Shares | 119,300 | 0.00 | 6,117 | -1.77 | ||||
| 2025-08-13 | 13F | Summit Financial, LLC | 77,595 | 12.97 | 4,209 | 15.07 | ||||
| 2025-07-08 | 13F | Lowe Wealth Advisors, LLC | 270 | 0.00 | 15 | 0.00 | ||||
| 2025-07-14 | 13F | Park Avenue Securities Llc | 3,999 | -0.87 | 0 | |||||
| 2025-07-30 | 13F | Strategic Investment Management, Llc | 0 | -100.00 | 0 | |||||
| 2025-07-03 | 13F | Fiduciary Financial Group, Llc | 117,468 | 15.59 | 6,450 | 32.63 | ||||
| 2025-07-08 | 13F | Chemistry Wealth Management LLC | 33,375 | -0.87 | 1,810 | 1.00 | ||||
| 2025-04-25 | 13F | Tradewinds Capital Management, LLC | 0 | -100.00 | 0 | -100.00 | ||||
| 2025-07-16 | 13F | ORG Partners LLC | 200 | -79.70 | 11 | -80.77 | ||||
| 2025-05-15 | 13F | Hrt Financial Lp | 0 | -100.00 | 0 | |||||
| 2025-07-16 | 13F | St Germain D J Co Inc | 775 | 0.00 | 42 | 2.44 | ||||
| 2025-07-16 | 13F | Brown, Lisle/cummings, Inc. | 67 | 0.00 | 4 | 0.00 | ||||
| 2025-08-12 | 13F | Cadence Wealth Management LLC | 80,554 | 21.65 | 4,369 | 23.91 | ||||
| 2025-07-16 | 13F | Old Port Advisors | 9,958 | -13.40 | 540 | -11.76 | ||||
| 2025-04-28 | 13F | Mainstream Capital Management LLC | 0 | -100.00 | 0 | |||||
| 2025-08-14 | 13F | Comerica Bank | 18,416 | -0.13 | 999 | 1.73 | ||||
| 2025-07-24 | 13F | JNBA Financial Advisors | 4,260 | -1.57 | 231 | 0.43 | ||||
| 2025-08-11 | 13F | Duff & Phelps Investment Management Co | 49,400 | 67.74 | 2,679 | 70.85 | ||||
| 2025-08-13 | 13F | Natixis Advisors, L.p. | 82,269 | -6.55 | 4 | 0.00 | ||||
| 2025-07-25 | 13F | Fifth Third Wealth Advisors LLC | 13,070 | 0.00 | 709 | 1.87 | ||||
| 2025-07-29 | 13F | Private Trust Co Na | 1,815 | 294.57 | 98 | 308.33 | ||||
| 2025-08-14 | 13F | Glenmede Investment Management, LP | 6,473 | 351 | ||||||
| 2025-07-16 | 13F | Prairiewood Capital, LLC | 227,104 | 4.32 | 12,318 | 6.26 | ||||
| 2025-07-31 | 13F | Ingalls & Snyder Llc | 18,440 | -0.67 | 1 | |||||
| 2025-08-13 | 13F | Capital Analysts, Inc. | 2,613 | 0.00 | 0 | |||||
| 2025-07-29 | 13F | Stratos Wealth Partners, LTD. | 8,039 | -12.15 | 436 | -10.47 | ||||
| 2025-08-08 | 13F | WASHINGTON TRUST Co | 0 | -100.00 | 0 | |||||
| 2025-07-29 | 13F | United Bank | 10,668 | -0.67 | 579 | 1.23 | ||||
| 2025-08-14 | 13F | Hirtle Callaghan & Co LLC | 5,086 | 0.00 | 276 | 1.85 | ||||
| 2025-08-15 | 13F | Johns Hopkins University | 1,572,088 | 0.00 | 85,270 | 1.86 | ||||
| 2025-07-28 | 13F | CGC Financial Services, LLC | 5,894 | -6.99 | 320 | -5.34 | ||||
| 2025-07-29 | 13F | Regions Financial Corp | 277 | 0.00 | 0 | |||||
| 2025-07-31 | 13F | Wealthfront Advisers Llc | 33,422 | -22.09 | 1,813 | -20.67 | ||||
| 2025-05-01 | 13F | High Note Wealth, LLC | 0 | -100.00 | 0 |
Other Listings
| MX:GNR |