Statistik Asas
| Pemilik Institusi | 122 total, 122 long only, 0 short only, 0 long/short - change of 2.52% MRQ |
| Purata Peruntukan Portfolio | 0.0685 % - change of -1.24% MRQ |
| Saham Institusi (Panjang) | 17,956,886 (ex 13D/G) - change of 0.26MM shares 1.47% MRQ |
| Nilai Institusi (Panjang) | $ 162,656 USD ($1000) |
Pemilikan Institusi dan Pemegang Saham
Companhia Paranaense de Energia - COPEL - Depositary Receipt (Common Stock) (US:ELP) telah 122 pemilik institusi dan pemegang saham yang telah memfailkan borang 13D/G atau 13F dengan Suruhanjaya Bursa Sekuriti (SEC). Institusi ini memegang sejumlah 17,956,886 saham. Pemegang saham terbesar termasuk Letko, Brosseau & Associates Inc, Vanguard Group Inc, VEIEX - Vanguard Emerging Markets Stock Index Fund Investor Shares, BlackRock, Inc., Goldman Sachs Group Inc, Morgan Stanley, SPX Equities Gestao de Recursos Ltda, Bank Of America Corp /de/, Optiver Holding B.V., and Robeco Institutional Asset Management B.V. .
Companhia Paranaense de Energia - COPEL - Depositary Receipt (Common Stock) (NYSE:ELP) struktur pemilikan institusi menunjukkan kedudukan semasa dalam syarikat mengikut institusi dan dana serta perubahan terkini dalam saiz kedudukan. Pemegang saham utama boleh termasuk pelabur individu, dana amanah, dana lindung nilai atau institusi. Jadual 13D menunjukkan bahawa pelabur memegang (atau menahan) lebih daripada 5% syarikat dan berhasrat (atau berniat) untuk secara aktif meneruskan perubahan dalam strategi perniagaan. Jadual 13G menunjukkan pelaburan pasif melebihi 5%.
The share price as of September 5, 2025 is 9.12 / share. Previously, on September 6, 2024, the share price was 7.73 / share. This represents an increase of 17.98% over that period.

Skor Sentimen Dana
Skor Sentimen Dana (Skor Pengumpulan Pemilikan fka) mencari saham yang paling banyak dibeli oleh dana. Ia adalah hasil daripada model kuantitatif pelbagai faktor yang canggih yang mengenal pasti syarikat dengan tahap pengumpulan institusi tertinggi. Model pemarkahan ini menggunakan gabungan jumlah kenaikan dalam pemilik yang didedahkan, perubahan dalam peruntukan portfolio dalam pemilik tersebut dan metrik lain. Nombornya berjulat dari 0 hingga 100, dengan nombor yang lebih tinggi menunjukkan tahap pengumpulan yang lebih tinggi kepada rakannya, dan 50 adalah nombor purata.
Kekerapan Kemas Kini: Harian
Lihat Peneroka Pemilikan yang menyediakan senarai syarikat yang mempunyai kedudukan tertinggi.
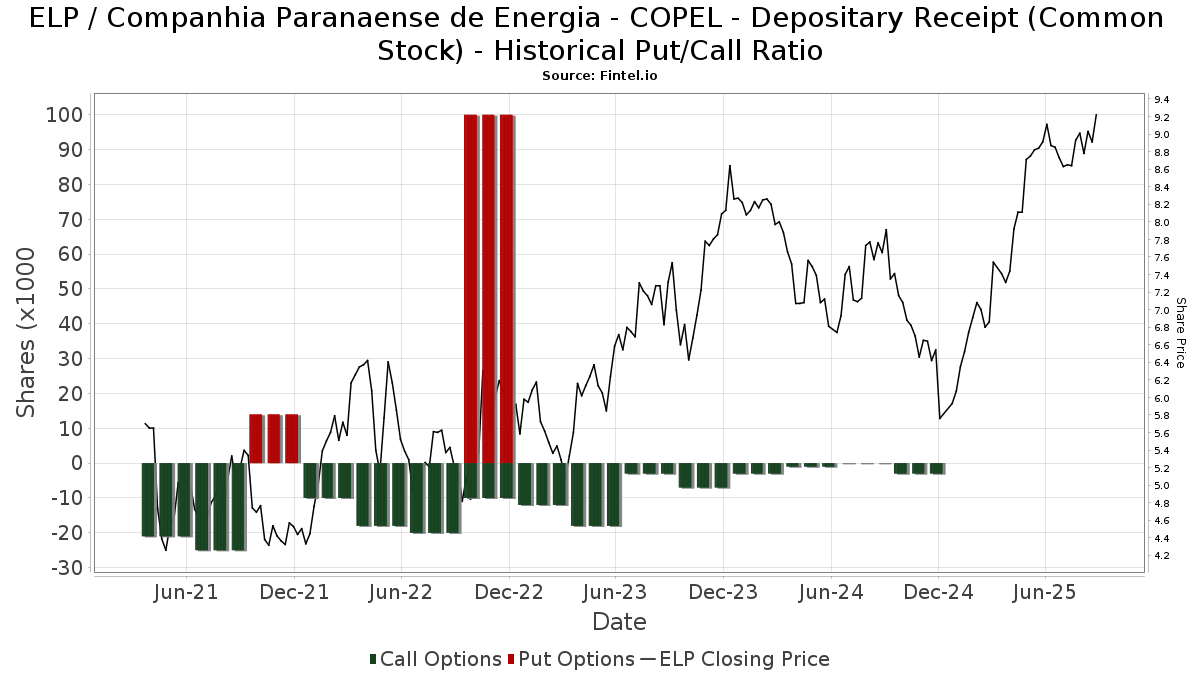
Nisbah Put/Call Institusi
Selain melaporkan isu ekuiti dan hutang standard, institusi yang mempunyai lebih daripada 100MM aset di bawah pengurusan juga mesti mendedahkan pegangan opsyen jual dan beli mereka. Memandangkan opsyen jual secara amnya menunjukkan sentimen negatif, dan opsyen beli menunjukkan sentimen positif, kita boleh mendapatkan gambaran keseluruhan sentimen institusi dengan merencanakan nisbah jual kepada beli. Carta di sebelah kanan memplotkan nisbah jual/beli sejarah untuk instrumen ini.
Menggunakan Nisbah Put/Callsebagai penunjuk sentimen pelabur mengatasi salah satu kekurangan utama menggunakan jumlah pemilikan institusi, iaitu sejumlah besar aset di bawah pengurusan dilaburkan secara pasif untuk menjejaki indeks. Dana yang diurus secara pasif biasanya tidak membeli opsyen, jadi penunjuk nisbah put/call mengekori rapat sentimen dana yang diurus secara aktif.
Pemfailan 13F dan NPORT
Butiran mengenai pemfailan 13F adalah percuma. Perincian mengenai pemfailan NP memerlukan keahlian premium. Baris hijau menunjukkan kedudukan baharu. Baris merah menunjukkan kedudukan tertutup. Klik pautan ikon untuk melihat sejarah transaksi penuh.
Naik Taraf
untuk membuka data premium dan mengeksport ke Excel ![]() .
.
| Tarikh Fail | Sumber | Pelabur | Jenis | Purata Harga (Ang) |
Saham | ΔSaham (%) |
Nilai Dilaporkan ($1000) |
Δ Nilai (%) |
Peruntukan Port (%) |
|
|---|---|---|---|---|---|---|---|---|---|---|
| 2025-08-14 | 13F | Ameriprise Financial Inc | 54,281 | 0.82 | 496 | 25.95 | ||||
| 2025-08-06 | 13F | SOUTH STATE Corp | 0 | -100.00 | 0 | |||||
| 2025-08-14 | 13F | Goldman Sachs Group Inc | 1,170,772 | 0.07 | 10,689 | 24.99 | ||||
| 2025-08-14 | 13F | Fmr Llc | 13,832 | 22.73 | 126 | 53.66 | ||||
| 2025-06-30 | NP | VEIEX - Vanguard Emerging Markets Stock Index Fund Investor Shares | 1,528,503 | -7.92 | 12,396 | 12.13 | ||||
| 2025-08-14 | 13F | Barometer Capital Management Inc. | 0 | -100.00 | 0 | |||||
| 2025-07-08 | 13F | Parallel Advisors, LLC | 4,932 | 1.23 | 45 | 28.57 | ||||
| 2025-08-13 | 13F | Quadrant Capital Group Llc | 29,483 | 1.26 | 269 | 26.89 | ||||
| 2025-08-14 | 13F | Aquatic Capital Management LLC | 46,230 | 58.50 | 422 | 98.12 | ||||
| 2025-08-13 | 13F | Guggenheim Capital Llc | 36,963 | -4.79 | 337 | 19.08 | ||||
| 2025-08-13 | 13F | Northwestern Mutual Wealth Management Co | 1,049 | -4.64 | 10 | 12.50 | ||||
| 2025-08-07 | 13F | Allworth Financial LP | 13,227 | 6,683.08 | 121 | 11,900.00 | ||||
| 2025-08-07 | 13F | Connor, Clark & Lunn Investment Management Ltd. | 54,449 | 0.00 | 497 | 24.87 | ||||
| 2025-08-13 | 13F | Grantham, Mayo, Van Otterloo & Co. LLC | 83,173 | 0.00 | 759 | 25.04 | ||||
| 2025-08-14 | 13F | Quantinno Capital Management LP | 118,059 | 53.68 | 1,078 | 91.98 | ||||
| 2025-08-14 | 13F | Optiver Holding B.V. | 541,587 | 0.00 | 4,945 | 24.88 | ||||
| 2025-06-26 | NP | DFEM - Dimensional Emerging Markets Core Equity 2 ETF | 21,675 | 10.73 | 176 | 34.62 | ||||
| 2025-08-28 | NP | CNRG - SPDR S&P Kensho Clean Power ETF This fund is a listed as child fund of State Street Corp and if that institution has disclosed ownership in this security, then these positions will not be double counted when calculating total shares and total value | 60,901 | -50.52 | 556 | -38.15 | ||||
| 2025-08-14 | 13F | Jane Street Group, Llc | 0 | -100.00 | 0 | |||||
| 2025-07-16 | 13F | Signaturefd, Llc | 15,509 | 14.94 | 142 | 43.88 | ||||
| 2025-07-18 | 13F | Robeco Institutional Asset Management B.V. | 479,169 | -46.48 | 4,375 | -33.16 | ||||
| 2025-08-14 | 13F | Bank Of America Corp /de/ | 544,714 | 97.65 | 4,973 | 146.92 | ||||
| 2025-07-24 | 13F | PDS Planning, Inc | 23,064 | 2.61 | 211 | 28.05 | ||||
| 2025-05-15 | 13F | Citadel Advisors Llc | Call | 0 | -100.00 | 0 | -100.00 | |||
| 2025-08-19 | 13F | Asset Dedication, LLC | 922 | 0.00 | 8 | 33.33 | ||||
| 2025-07-30 | 13F | FNY Investment Advisers, LLC | 0 | -100.00 | 0 | |||||
| 2025-05-15 | 13F | Citadel Advisors Llc | Put | 0 | -100.00 | 0 | -100.00 | |||
| 2025-08-06 | 13F | True Wealth Design, LLC | 20 | 0.00 | 0 | |||||
| 2025-04-11 | 13F | First Affirmative Financial Network | 16,663 | 53.42 | 122 | 89.06 | ||||
| 2025-08-12 | 13F | BlackRock, Inc. | 1,235,793 | 4.35 | 11,283 | 30.32 | ||||
| 2025-05-05 | 13F | Eagle Bay Advisors LLC | 0 | -100.00 | 0 | -100.00 | ||||
| 2025-08-12 | 13F | SPX Equities Gestao de Recursos Ltda | 916,030 | -17.54 | 8,363 | 2.99 | ||||
| 2025-06-30 | NP | VGTSX - Vanguard Total International Stock Index Fund Investor Shares | 8,914 | 0.00 | 72 | 22.03 | ||||
| 2025-08-04 | 13F | Assetmark, Inc | 15 | 0 | ||||||
| 2025-08-13 | 13F | West Family Investments, Inc. | 13,105 | 0.00 | 120 | 25.26 | ||||
| 2025-08-14 | 13F | Vident Advisory, LLC | 102,641 | -3.12 | 937 | 21.06 | ||||
| 2025-08-14 | 13F | UBS Group AG | 17,957 | -54.90 | 164 | -43.99 | ||||
| 2025-08-12 | 13F | Clear Street Markets Llc | 0 | -100.00 | 0 | |||||
| 2025-09-04 | 13F/A | Advisor Group Holdings, Inc. | 402 | 332.26 | 4 | |||||
| 2025-07-24 | 13F | Jfs Wealth Advisors, Llc | 94 | 49.21 | 1 | |||||
| 2025-08-18 | 13F/A | National Bank Of Canada /fi/ | 405 | 4 | ||||||
| 2025-07-24 | 13F | Ronald Blue Trust, Inc. | 10,183 | -7.63 | 93 | 15.00 | ||||
| 2025-08-08 | 13F | Letko, Brosseau & Associates Inc | 6,704,446 | -0.15 | 61,212 | 24.71 | ||||
| 2025-08-13 | 13F | Hsbc Holdings Plc | 109,561 | 24.94 | 973 | 51.79 | ||||
| 2025-07-30 | NP | BRAZ - Global X Brazil Active ETF | 12,002 | 26.34 | 108 | 69.84 | ||||
| 2025-08-13 | 13F | Marshall Wace, Llp | 134,477 | 1,228 | ||||||
| 2025-07-29 | 13F | Wealthstream Advisors, Inc. | 13,590 | 29.79 | 124 | 63.16 | ||||
| 2025-08-08 | 13F | Larson Financial Group LLC | 24 | 0 | ||||||
| 2025-08-12 | 13F | SRS Capital Advisors, Inc. | 1,303 | 2.12 | 12 | 22.22 | ||||
| 2025-08-13 | 13F | Walleye Capital LLC | 12,092 | 110 | ||||||
| 2025-08-12 | 13F | Jpmorgan Chase & Co | 10,151 | 4,094.63 | 93 | 9,100.00 | ||||
| 2025-08-14 | 13F | Citadel Advisors Llc | 27,972 | 255 | ||||||
| 2025-06-26 | NP | DFSE - Dimensional Emerging Markets Sustainability Core 1 ETF | 11,475 | 13.33 | 93 | 38.81 | ||||
| 2025-08-21 | NP | SMOG - VanEck Vectors Low Carbon Energy ETF | 75,659 | -6.13 | 691 | 17.15 | ||||
| 2025-08-12 | 13F | CIBC Private Wealth Group, LLC | 391 | 4 | ||||||
| 2025-08-13 | 13F | Invesco Ltd. | 33,755 | 53.38 | 308 | 92.50 | ||||
| 2025-08-11 | 13F | Vanguard Group Inc | 1,767,272 | 0.00 | 16,135 | 24.90 | ||||
| 2025-08-13 | 13F | EverSource Wealth Advisors, LLC | 4,318 | 279.10 | 39 | 387.50 | ||||
| 2025-07-11 | 13F | Farther Finance Advisors, LLC | 318 | 1.60 | 3 | 0.00 | ||||
| 2025-04-29 | 13F | Lee Danner & Bass Inc | 0 | -100.00 | 0 | -100.00 | ||||
| 2025-05-28 | NP | EMIF - iShares Emerging Markets Infrastructure ETF | 20,452 | 0.41 | 150 | 24.17 | ||||
| 2025-08-11 | 13F | Banque Cantonale Vaudoise | 4,828 | 0.00 | 0 | |||||
| 2025-06-11 | NP | SLANX - DWS Latin America Equity Fund Class A | 29,109 | 185.97 | 236 | 252.24 | ||||
| 2025-06-26 | NP | DEXC - Dimensional Emerging Markets ex China Core Equity ETF | 12,051 | 21.10 | 98 | 46.97 | ||||
| 2025-06-30 | NP | VEU - Vanguard FTSE All-World ex-US Index Fund ETF Shares | 112,597 | 0.00 | 913 | 21.90 | ||||
| 2025-08-14 | 13F | Two Sigma Advisers, Lp | 80,420 | -54.16 | 734 | -42.75 | ||||
| 2025-06-26 | NP | Dfa Investment Trust Co - The Emerging Markets Series This fund is a listed as child fund of Dimensional Fund Advisors Lp and if that institution has disclosed ownership in this security, then these positions will not be double counted when calculating total shares and total value | 17,400 | 0.00 | 141 | 22.61 | ||||
| 2025-08-08 | 13F | Creative Planning | 121,104 | 18.43 | 1,106 | 47.93 | ||||
| 2025-08-08 | 13F | Pnc Financial Services Group, Inc. | 18,923 | 16.08 | 173 | 44.54 | ||||
| 2025-08-14 | 13F | State Street Corp | 60,901 | -50.52 | 556 | -38.15 | ||||
| 2025-08-14 | 13F | Raymond James Financial Inc | 108,577 | 91.22 | 991 | 138.80 | ||||
| 2025-08-12 | 13F | LPL Financial LLC | 26,909 | 99.25 | 246 | 150.00 | ||||
| 2025-08-12 | 13F | Dimensional Fund Advisors Lp | 174,232 | 15.69 | 1,586 | 44.18 | ||||
| 2025-08-14 | 13F | Cubist Systematic Strategies, LLC | 39,628 | 54.35 | 362 | 93.05 | ||||
| 2025-08-14 | 13F | Mercer Global Advisors Inc /adv | 11,729 | -1.78 | 107 | 22.99 | ||||
| 2025-08-14 | 13F | MIRAE ASSET GLOBAL ETFS HOLDINGS Ltd. | 15,852 | 87.60 | 145 | 136.07 | ||||
| 2025-08-14 | 13F | Van Eck Associates Corp | 75,659 | -6.13 | 1 | |||||
| 2025-08-14 | 13F | Ieq Capital, Llc | 13,670 | 125 | ||||||
| 2025-07-18 | 13F | PFG Investments, LLC | 10,202 | 93 | ||||||
| 2025-08-13 | 13F | Renaissance Technologies Llc | 381,718 | 131.62 | 3,485 | 189.45 | ||||
| 2025-08-14 | 13F | Mariner, LLC | 35,690 | 33.22 | 326 | 66.67 | ||||
| 2025-08-12 | 13F | Clearbridge Investments, LLC | 20,152 | 61.09 | 184 | 101.10 | ||||
| 2025-05-15 | 13F | Manufacturers Life Insurance Company, The | 0 | -100.00 | 0 | |||||
| 2025-08-04 | 13F | Hantz Financial Services, Inc. | 11,730 | 876.69 | 0 | |||||
| 2025-08-14 | 13F | Prelude Capital Management, Llc | 38,000 | -15.56 | 347 | 5.49 | ||||
| 2025-07-30 | 13F | Ethic Inc. | 39,022 | 7.36 | 348 | 28.52 | ||||
| 2025-08-07 | 13F | Sierra Ocean, Llc | 170 | 0.00 | 2 | 0.00 | ||||
| 2025-07-28 | NP | AVEEX - Avantis Emerging Markets Equity Fund Institutional Class This fund is a listed as child fund of American Century Companies Inc and if that institution has disclosed ownership in this security, then these positions will not be double counted when calculating total shares and total value | 14,158 | 0.00 | 127 | 35.11 | ||||
| 2025-08-14 | 13F | Boston Private Wealth Llc | 0 | -100.00 | 0 | |||||
| 2025-07-24 | 13F | Us Bancorp \de\ | 18,985 | 3.66 | 173 | 30.08 | ||||
| 2025-05-15 | 13F | Qube Research & Technologies Ltd | 0 | -100.00 | 0 | |||||
| 2025-08-14 | 13F | Royal Bank Of Canada | 1,922 | -75.17 | 18 | -67.86 | ||||
| 2025-07-25 | 13F | JustInvest LLC | 23,650 | 1.06 | 216 | 25.73 | ||||
| 2025-08-12 | 13F | Coldstream Capital Management Inc | 0 | -100.00 | 0 | |||||
| 2025-08-12 | 13F | Proequities, Inc. | 0 | 0 | ||||||
| 2025-08-14 | 13F | Millennium Management Llc | 104,417 | 953 | ||||||
| 2025-08-15 | 13F | Tower Research Capital LLC (TRC) | 3,116 | 36.25 | 28 | 75.00 | ||||
| 2025-08-05 | 13F | NewSquare Capital LLC | 188 | 261.54 | 2 | |||||
| 2025-07-14 | 13F | GAMMA Investing LLC | 10,968 | 40.71 | 100 | 78.57 | ||||
| 2025-07-31 | 13F | R Squared Ltd | 14,375 | 3.40 | 131 | 29.70 | ||||
| 2025-08-13 | 13F | Russell Investments Group, Ltd. | 31,980 | 0.00 | 292 | 24.89 | ||||
| 2025-06-18 | NP | RTXAX - Tax-Managed Real Assets Fund Class A | 31,980 | 0.00 | 259 | 22.17 | ||||
| 2025-08-14 | 13F | Aqr Capital Management Llc | 42,350 | -14.63 | 387 | 6.63 | ||||
| 2025-08-13 | 13F | Jones Financial Companies Lllp | 166 | 1 | ||||||
| 2025-08-11 | 13F | Citigroup Inc | 32,566 | -14.11 | 297 | 7.22 | ||||
| 2025-08-12 | 13F | O'shaughnessy Asset Management, Llc | 11,414 | -10.25 | 104 | 13.04 | ||||
| 2025-08-14 | 13F | Two Sigma Investments, Lp | 122,422 | -36.32 | 1,118 | -20.50 | ||||
| 2025-07-25 | 13F | Cwm, Llc | 6,063 | 9.03 | 0 | |||||
| 2025-08-12 | 13F | Atlas Capital Advisors Llc | 5,177 | 0.00 | 47 | 27.03 | ||||
| 2025-07-15 | 13F | Ballentine Partners, LLC | 29,435 | -7.06 | 269 | 16.02 | ||||
| 2025-08-14 | 13F | Wetherby Asset Management Inc | 26,191 | 20.27 | 239 | 85.27 | ||||
| 2025-05-07 | 13F | Sheaff Brock Investment Advisors, LLC | 13,000 | 0.00 | 95 | 23.38 | ||||
| 2025-08-11 | 13F | Bell Investment Advisors, Inc | 257 | 0.00 | 2 | 100.00 | ||||
| 2025-08-15 | 13F | Morgan Stanley | 1,017,792 | 8.83 | 9,292 | 35.93 | ||||
| 2025-07-21 | 13F | Mirae Asset Global Investments Co., Ltd. | 14,171 | 68.92 | 129 | 111.48 | ||||
| 2025-08-14 | 13F | Bnp Paribas Arbitrage, Sa | 25,876 | 185.10 | 236 | 257.58 | ||||
| 2025-08-12 | 13F | XTX Topco Ltd | 0 | -100.00 | 0 | |||||
| 2025-08-08 | 13F | SBI Securities Co., Ltd. | 151 | -1.31 | 1 | 0.00 | ||||
| 2025-08-08 | NP | QGBLX - Quantified Global Fund Investor Class | 37,017 | 338 | ||||||
| 2025-08-13 | 13F | Cerity Partners LLC | 13,402 | -3.07 | 122 | 20.79 | ||||
| 2025-07-28 | NP | NSI - National Security Emerging Markets Index ETF | 1,552 | 38.32 | 14 | 85.71 | ||||
| 2025-07-31 | 13F | Caitong International Asset Management Co., Ltd | 58 | -84.07 | 1 | -100.00 | ||||
| 2025-05-05 | 13F | Lindbrook Capital, Llc | 10,187 | 6.05 | 74 | 32.14 | ||||
| 2025-07-25 | 13F | Wealth Architects, LLC | 24,326 | -1.15 | 222 | 24.02 | ||||
| 2025-08-12 | 13F | American Century Companies Inc | 200,887 | -3.35 | 1,834 | 20.74 | ||||
| 2025-05-15 | 13F | Point72 Asset Management, L.P. | 0 | -100.00 | 0 | |||||
| 2025-08-13 | 13F | OMERS ADMINISTRATION Corp | 0 | -100.00 | 0 | |||||
| 2025-08-13 | 13F | First Trust Advisors Lp | 15,744 | -23.61 | 144 | -4.67 | ||||
| 2025-08-12 | 13F | MAI Capital Management | 658 | -64.39 | 6 | -53.85 | ||||
| 2025-08-27 | 13F/A | Squarepoint Ops LLC | 0 | -100.00 | 0 | -100.00 | ||||
| 2025-07-28 | NP | AVEM - Avantis Emerging Markets Equity ETF This fund is a listed as child fund of American Century Companies Inc and if that institution has disclosed ownership in this security, then these positions will not be double counted when calculating total shares and total value | 187,574 | 0.00 | 1,684 | 34.83 | ||||
| 2025-06-26 | NP | DFAE - Dimensional Emerging Core Equity Market ETF | 67,550 | 32.32 | 548 | 61.36 | ||||
| 2025-07-28 | 13F | Harbour Investments, Inc. | 96 | 0.00 | 1 | |||||
| 2025-08-11 | 13F | Trium Capital LLP | 0 | -100.00 | 0 | |||||
| 2025-08-14 | 13F | Federation des caisses Desjardins du Quebec | 1,200 | 11 | ||||||
| 2025-08-14 | 13F/A | Skopos Labs, Inc. | 18,893 | 199.22 | 172 | 273.91 | ||||
| 2025-04-22 | NP | APIE - ActivePassive International Equity ETF | 0 | -100.00 | 0 | -100.00 | ||||
| 2025-08-14 | 13F | Wells Fargo & Company/mn | 1,492 | 14 | ||||||
| 2025-07-28 | NP | AVSE - Avantis Responsible Emerging Markets Equity ETF | 6,581 | 13.25 | 59 | 55.26 | ||||
| 2025-08-13 | 13F | Twin Peaks Wealth Advisors, LLC | 304 | 3 | ||||||
| 2025-08-12 | 13F | Rhumbline Advisers | 47,395 | 0.60 | 433 | 25.58 | ||||
| 2025-08-14 | 13F | Brevan Howard Capital Management LP | 85,000 | 768 | ||||||
| 2025-05-15 | 13F | Engineers Gate Manager LP | 0 | -100.00 | 0 |