Statistik Asas
| Pemilik Institusi | 117 total, 115 long only, 0 short only, 2 long/short - change of 9.35% MRQ |
| Purata Peruntukan Portfolio | 0.1988 % - change of -2.64% MRQ |
| Saham Institusi (Panjang) | 30,143,443 (ex 13D/G) - change of 2.10MM shares 7.50% MRQ |
| Nilai Institusi (Panjang) | $ 519,795 USD ($1000) |
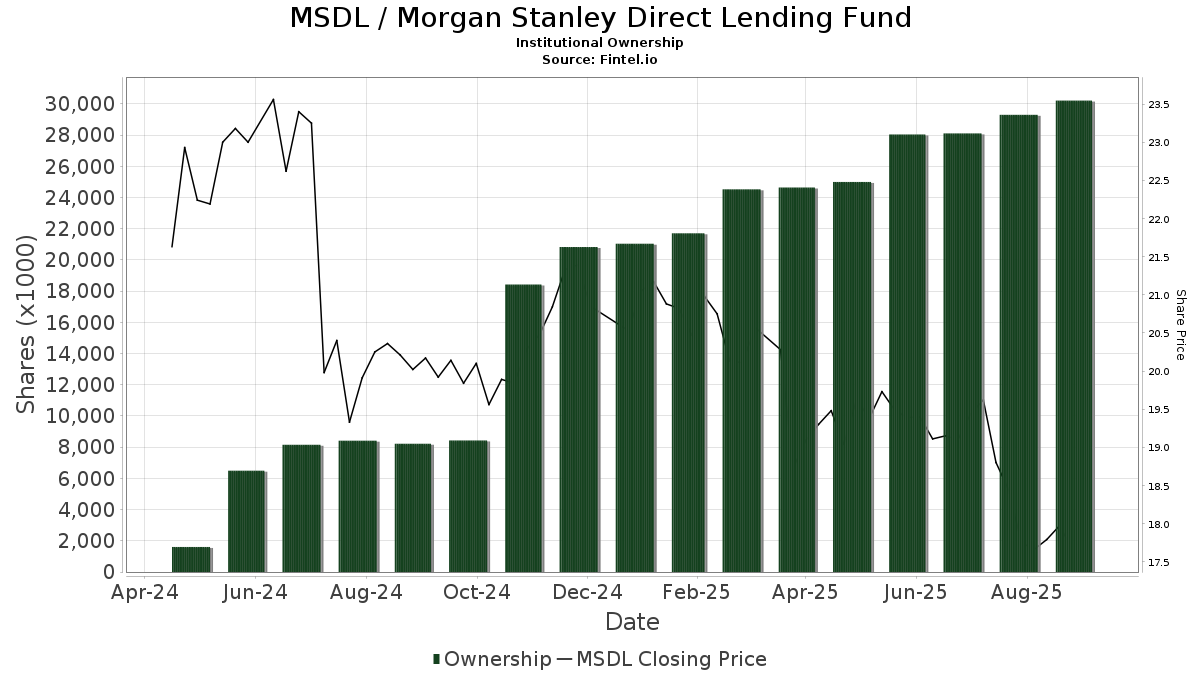
Pemilikan Institusi dan Pemegang Saham
Morgan Stanley Direct Lending Fund (US:MSDL) telah 117 pemilik institusi dan pemegang saham yang telah memfailkan borang 13D/G atau 13F dengan Suruhanjaya Bursa Sekuriti (SEC). Institusi ini memegang sejumlah 30,143,443 saham. Pemegang saham terbesar termasuk Morgan Stanley, Van Eck Associates Corp, Generali Asset Management SPA SGR, BIZD - VanEck Vectors BDC Income ETF, UBS Group AG, Muzinich & Co., Inc., Americana Partners, LLC, Sumitomo Mitsui Trust Holdings, Inc., Millennium Management Llc, and Franklin Resources Inc .
Morgan Stanley Direct Lending Fund (NYSE:MSDL) struktur pemilikan institusi menunjukkan kedudukan semasa dalam syarikat mengikut institusi dan dana serta perubahan terkini dalam saiz kedudukan. Pemegang saham utama boleh termasuk pelabur individu, dana amanah, dana lindung nilai atau institusi. Jadual 13D menunjukkan bahawa pelabur memegang (atau menahan) lebih daripada 5% syarikat dan berhasrat (atau berniat) untuk secara aktif meneruskan perubahan dalam strategi perniagaan. Jadual 13G menunjukkan pelaburan pasif melebihi 5%.
The share price as of September 5, 2025 is 17.97 / share. Previously, on September 9, 2024, the share price was 19.73 / share. This represents a decline of 8.92% over that period.
Skor Sentimen Dana
Skor Sentimen Dana (Skor Pengumpulan Pemilikan fka) mencari saham yang paling banyak dibeli oleh dana. Ia adalah hasil daripada model kuantitatif pelbagai faktor yang canggih yang mengenal pasti syarikat dengan tahap pengumpulan institusi tertinggi. Model pemarkahan ini menggunakan gabungan jumlah kenaikan dalam pemilik yang didedahkan, perubahan dalam peruntukan portfolio dalam pemilik tersebut dan metrik lain. Nombornya berjulat dari 0 hingga 100, dengan nombor yang lebih tinggi menunjukkan tahap pengumpulan yang lebih tinggi kepada rakannya, dan 50 adalah nombor purata.
Kekerapan Kemas Kini: Harian
Lihat Peneroka Pemilikan yang menyediakan senarai syarikat yang mempunyai kedudukan tertinggi.
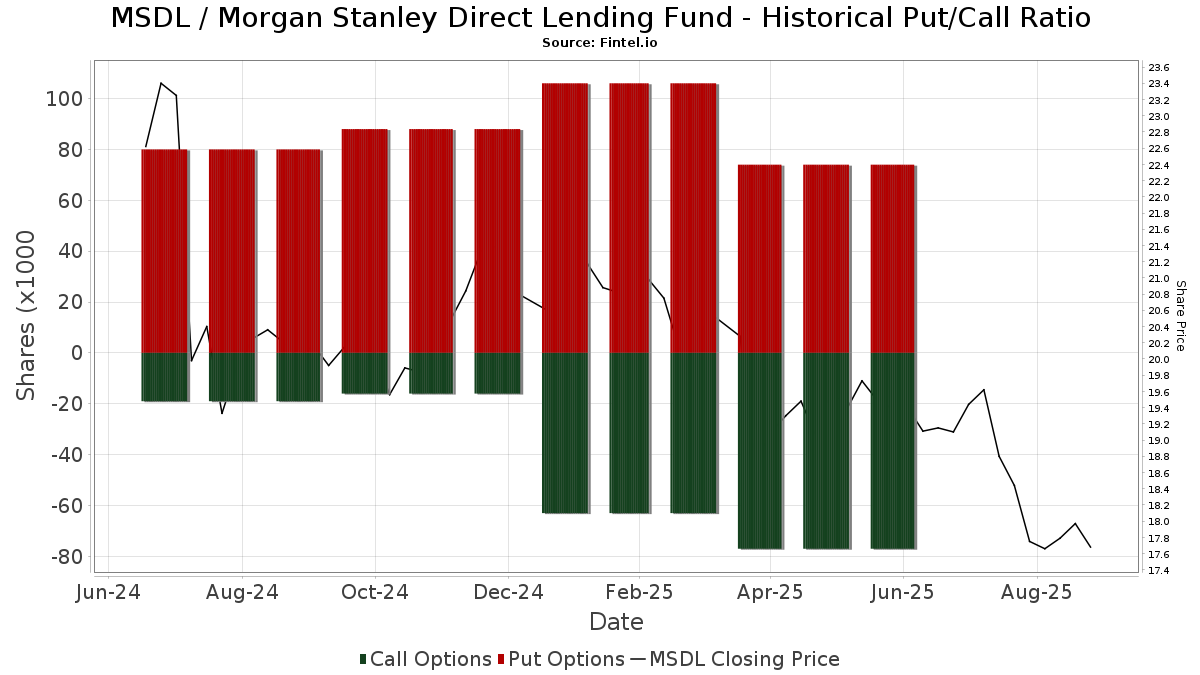
Nisbah Put/Call Institusi
Selain melaporkan isu ekuiti dan hutang standard, institusi yang mempunyai lebih daripada 100MM aset di bawah pengurusan juga mesti mendedahkan pegangan opsyen jual dan beli mereka. Memandangkan opsyen jual secara amnya menunjukkan sentimen negatif, dan opsyen beli menunjukkan sentimen positif, kita boleh mendapatkan gambaran keseluruhan sentimen institusi dengan merencanakan nisbah jual kepada beli. Carta di sebelah kanan memplotkan nisbah jual/beli sejarah untuk instrumen ini.
Menggunakan Nisbah Put/Callsebagai penunjuk sentimen pelabur mengatasi salah satu kekurangan utama menggunakan jumlah pemilikan institusi, iaitu sejumlah besar aset di bawah pengurusan dilaburkan secara pasif untuk menjejaki indeks. Dana yang diurus secara pasif biasanya tidak membeli opsyen, jadi penunjuk nisbah put/call mengekori rapat sentimen dana yang diurus secara aktif.
Pemfailan 13F dan NPORT
Butiran mengenai pemfailan 13F adalah percuma. Perincian mengenai pemfailan NP memerlukan keahlian premium. Baris hijau menunjukkan kedudukan baharu. Baris merah menunjukkan kedudukan tertutup. Klik pautan ikon untuk melihat sejarah transaksi penuh.
Naik Taraf
untuk membuka data premium dan mengeksport ke Excel ![]() .
.
| Tarikh Fail | Sumber | Pelabur | Jenis | Purata Harga (Ang) |
Saham | ΔSaham (%) |
Nilai Dilaporkan ($1000) |
Δ Nilai (%) |
Peruntukan Port (%) |
|
|---|---|---|---|---|---|---|---|---|---|---|
| 2025-07-31 | 13F | Caitong International Asset Management Co., Ltd | 80 | 1 | ||||||
| 2025-08-14 | 13F | Group One Trading, L.p. | 900 | 17 | ||||||
| 2025-05-15 | 13F | CAPROCK Group, Inc. | 0 | -100.00 | 0 | |||||
| 2025-08-14 | 13F | Icon Wealth Advisors, LLC | 16,006 | 2.58 | 300 | -3.86 | ||||
| 2025-08-14 | 13F | Engineers Gate Manager LP | 13,709 | 257 | ||||||
| 2025-08-14 | 13F | Citadel Advisors Llc | Put | 48,800 | -23.39 | 914 | -28.17 | |||
| 2025-08-14 | 13F | Bnp Paribas Arbitrage, Sa | 15,966 | 299 | ||||||
| 2025-07-25 | 13F | Total Clarity Wealth Management, Inc. | 0 | -100.00 | 0 | |||||
| 2025-08-13 | 13F | ExodusPoint Capital Management, LP | 0 | -100.00 | 0 | |||||
| 2025-08-14 | 13F | Citadel Advisors Llc | 67,673 | -75.51 | 1,267 | -77.04 | ||||
| 2025-08-14 | 13F | Citadel Advisors Llc | Call | 65,300 | 37.18 | 1,222 | 28.63 | |||
| 2025-08-12 | 13F | Dynamic Technology Lab Private Ltd | 16,791 | 314 | ||||||
| 2025-08-14 | 13F | Susquehanna International Group, Llp | 21,522 | -36.76 | 403 | -40.80 | ||||
| 2025-08-14 | 13F | Susquehanna International Group, Llp | Call | 11,700 | -25.48 | 219 | -30.03 | |||
| 2025-08-14 | 13F | Susquehanna International Group, Llp | Put | 26,000 | -39.11 | 487 | -42.96 | |||
| 2025-08-04 | 13F | Muzinich & Co., Inc. | 455,631 | 114.21 | 8,529 | 100.92 | ||||
| 2025-08-14 | 13F | Comerica Bank | 1,137 | -57.73 | 21 | -60.38 | ||||
| 2025-05-27 | NP | GMOV - GMO U.S. Value ETF | 7,089 | 417.45 | 141 | 403.57 | ||||
| 2025-08-08 | 13F | Pnc Financial Services Group, Inc. | 1,240 | 0.00 | 23 | -4.17 | ||||
| 2025-08-14 | 13F | Stifel Financial Corp | 129,989 | 0.51 | 2,433 | -5.73 | ||||
| 2025-08-14 | 13F | Kovitz Investment Group Partners, LLC | 18,023 | 43.21 | 340 | 35.06 | ||||
| 2025-08-13 | 13F | Quantbot Technologies LP | 6,294 | 118 | ||||||
| 2025-08-15 | 13F | Zuckerman Investment Group, LLC | 44,000 | 0.00 | 824 | -6.26 | ||||
| 2025-08-12 | 13F | Virtu Financial LLC | 17,107 | -25.88 | 0 | |||||
| 2025-08-06 | 13F | Black Swift Group, LLC | 0 | -100.00 | 0 | |||||
| 2025-08-14 | 13F | Two Sigma Investments, Lp | 153,199 | -35.98 | 2,868 | -39.97 | ||||
| 2025-06-18 | NP | Putnam ETF Trust - Putnam BDC ETF - | 284,477 | 3.79 | 5,542 | -3.77 | ||||
| 2025-08-25 | 13F/A | Promus Capital, LLC | 12,000 | 0.00 | 225 | -6.28 | ||||
| 2025-08-08 | 13F | Creative Planning | 0 | -100.00 | 0 | |||||
| 2025-08-25 | 13F/A | Neuberger Berman Group LLC | 261,767 | 8.37 | 4,900 | 1.64 | ||||
| 2025-08-12 | 13F | Franklin Resources Inc | 350,124 | 8.24 | 6,554 | 1.52 | ||||
| 2025-08-14 | 13F | Brevan Howard Capital Management LP | 29,406 | 550 | ||||||
| 2025-08-12 | 13F | Pathstone Holdings, LLC | 37,234 | 4.73 | 700 | -1.83 | ||||
| 2025-08-12 | 13F | Cowa, Llc | 13,436 | 0.00 | 252 | -6.34 | ||||
| 2025-08-12 | 13F | MAI Capital Management | 97,917 | -1.41 | 1,833 | -7.52 | ||||
| 2025-08-14 | 13F | Van Eck Associates Corp | 1,919,449 | 2.18 | 36 | -5.41 | ||||
| 2025-08-14 | 13F | LM Advisors LLC | 56,842 | -21.87 | 1 | 0.00 | ||||
| 2025-08-05 | 13F | Simplex Trading, Llc | 12,822 | -28.38 | 0 | |||||
| 2025-08-13 | 13F | Lido Advisors, LLC | 27,412 | 75.39 | 527 | 64.89 | ||||
| 2025-07-24 | 13F | Shikiar Asset Management Inc | 159,100 | -8.48 | 3 | -33.33 | ||||
| 2025-08-12 | 13F | LPL Financial LLC | 171,454 | 40.95 | 3,210 | 32.17 | ||||
| 2025-08-14 | 13F | Goldman Sachs Group Inc | 38,366 | 718 | ||||||
| 2025-08-22 | 13F/A | TT Capital Management LLC | 237,762 | 19.62 | 4,451 | 12.18 | ||||
| 2025-08-13 | 13F | Grantham, Mayo, Van Otterloo & Co. LLC | 0 | -100.00 | 0 | |||||
| 2025-07-18 | 13F | Generali Investments CEE, investicni spolecnost, a.s. | 21,922 | 0.00 | 410 | -6.18 | ||||
| 2025-08-14 | 13F | Two Sigma Advisers, Lp | 38,100 | -65.89 | 713 | -68.01 | ||||
| 2025-07-21 | 13F | Ameritas Advisory Services, LLC | 2,210 | 41 | ||||||
| 2025-08-13 | 13F | Marshall Wace, Llp | 92,501 | 1,732 | ||||||
| 2025-07-31 | 13F | Sumitomo Mitsui Trust Holdings, Inc. | 370,759 | 85.11 | 6,941 | 73.63 | ||||
| 2025-08-07 | 13F | Hennion & Walsh Asset Management, Inc. | 150,143 | 69.31 | 2,811 | 58.76 | ||||
| 2025-08-14 | 13F | Sciencast Management LP | 11,236 | -62.83 | 210 | -65.17 | ||||
| 2025-08-11 | 13F | Nordwand Advisors, LLC | 24,336 | -21.96 | 456 | -26.85 | ||||
| 2025-05-30 | NP | Cliffwater Corporate Lending Fund | 242,195 | -83.25 | 4,834 | -83.82 | ||||
| 2025-05-14 | 13F | Virtus ETF Advisers LLC | 0 | -100.00 | 0 | |||||
| 2025-07-28 | 13F | BRYN MAWR TRUST Co | 20,000 | 0.00 | 374 | -6.27 | ||||
| 2025-08-13 | 13F | ASB Consultores, LLC | 80,310 | 0.00 | 1,503 | -6.18 | ||||
| 2025-08-14 | 13F | Royal Bank Of Canada | 159,694 | 2.87 | 2,989 | -3.52 | ||||
| 2025-08-21 | NP | BIZD - VanEck Vectors BDC Income ETF | 1,678,186 | -3.27 | 31,416 | -9.28 | ||||
| 2025-08-28 | NP | RNCOX - RiverNorth Core Opportunity Fund Class R | 9,601 | 180 | ||||||
| 2025-08-07 | 13F | Americana Partners, LLC | 378,154 | 3.09 | 7,079 | -3.31 | ||||
| 2025-07-29 | 13F | Activest Wealth Management | 171,562 | 10.41 | 3,212 | 3.55 | ||||
| 2025-08-14 | 13F | Bank Of America Corp /de/ | 96,933 | 125.61 | 1,815 | 111.67 | ||||
| 2025-08-14 | 13F | Balyasny Asset Management Llc | 89,896 | -10.80 | 1,683 | -16.36 | ||||
| 2025-07-14 | 13F | Opal Wealth Advisors, LLC | 17,844 | -18.55 | 334 | -23.57 | ||||
| 2025-08-27 | 13F/A | Squarepoint Ops LLC | 34,712 | -26.73 | 650 | -31.32 | ||||
| 2025-07-24 | 13F | Us Bancorp \de\ | 2,290 | 43 | ||||||
| 2025-08-14 | 13F | UBS Group AG | 820,828 | 31.38 | 15,366 | 23.22 | ||||
| 2025-08-12 | 13F | Sfmg, Llc | 258,445 | 0.63 | 4,838 | -5.62 | ||||
| 2025-08-11 | 13F | HighTower Advisors, LLC | 15,457 | -52.81 | 289 | -55.74 | ||||
| 2025-08-12 | 13F | Entropy Technologies, LP | 0 | -100.00 | 0 | |||||
| 2025-07-08 | 13F | Everpar Advisors Llc | 28,609 | -20.59 | 536 | -25.59 | ||||
| 2025-08-14 | 13F | Millennium Management Llc | 352,531 | 77.43 | 6,599 | 66.43 | ||||
| 2025-08-14 | 13F | Nebula Research & Development LLC | 23,422 | 438 | ||||||
| 2025-08-11 | 13F | Citigroup Inc | 0 | -100.00 | 0 | |||||
| 2025-07-25 | NP | First Trust Specialty Finance & Financial Opportunities Fund This fund is a listed as child fund of First Trust Advisors Lp and if that institution has disclosed ownership in this security, then these positions will not be double counted when calculating total shares and total value | 60,000 | 500.00 | 1,185 | 486.63 | ||||
| 2025-08-15 | 13F | Tower Research Capital LLC (TRC) | 1,929 | 48.61 | 36 | 44.00 | ||||
| 2025-08-13 | 13F | Virtus Investment Advisers, Inc. | 20,380 | -3.57 | 382 | -9.50 | ||||
| 2025-07-29 | NP | GBFFX - GMO Benchmark-Free Fund Class III | 0 | -100.00 | 0 | -100.00 | ||||
| 2025-08-14 | 13F/A | Rockefeller Capital Management L.P. | 74,477 | 0.31 | 1,394 | -5.87 | ||||
| 2025-07-21 | 13F | Patriot Financial Group Insurance Agency, LLC | 11,200 | 210 | ||||||
| 2025-07-30 | 13F | Denali Advisors Llc | 86,581 | -3.00 | 1,621 | -9.04 | ||||
| 2025-08-01 | 13F | Envestnet Asset Management Inc | 18,247 | 342 | ||||||
| 2025-08-28 | NP | Rivernorth Opportunities Fund, Inc. | 69,818 | 1,307 | ||||||
| 2025-07-29 | NP | GIMFX - GMO Implementation Fund | 0 | -100.00 | 0 | -100.00 | ||||
| 2025-07-22 | 13F | Gsa Capital Partners Llp | 0 | -100.00 | 0 | |||||
| 2025-07-29 | NP | PPADX - GMO U.S. Opportunistic Value Fund Class III | 0 | -100.00 | 0 | -100.00 | ||||
| 2025-07-28 | 13F | Generali Asset Management SPA SGR | 1,761,950 | 99.86 | 32,984 | 87.45 | ||||
| 2025-06-25 | NP | VPC - Virtus Private Credit Strategy ETF | 19,305 | 26.22 | 376 | 17.13 | ||||
| 2025-07-08 | 13F/A | Adams Asset Advisors, LLC | 90,516 | 43.69 | 1,694 | 34.77 | ||||
| 2025-08-12 | 13F | Trexquant Investment LP | 141,494 | 2,649 | ||||||
| 2025-08-13 | 13F | Cliffwater LLC | 0 | -100.00 | 0 | |||||
| 2025-07-31 | 13F | Oppenheimer & Co Inc | 18,213 | 36.47 | 341 | 27.82 | ||||
| 2025-05-08 | 13F | XTX Topco Ltd | 0 | -100.00 | 0 | |||||
| 2025-08-14 | 13F | Raymond James Financial Inc | 211,041 | 1.51 | 3,951 | -4.80 | ||||
| 2025-08-14 | 13F | Mercer Global Advisors Inc /adv | 14,539 | 272 | ||||||
| 2025-08-07 | 13F | Allworth Financial LP | 2,606 | 62.27 | 49 | 54.84 | ||||
| 2025-07-22 | 13F | Grimes & Company, Inc. | 12,928 | -27.67 | 242 | -32.02 | ||||
| 2025-07-22 | 13F | Global Strategic Investment Solutions, LLC | 17,234 | 323 | ||||||
| 2025-08-05 | 13F | Gilbert & Cook, Inc. | 12,131 | 0.00 | 227 | -6.20 | ||||
| 2025-08-13 | 13F | Invesco Ltd. | 50,500 | 35.34 | 945 | 27.02 | ||||
| 2025-08-13 | 13F | Legacy Capital Wealth Partners, LLC | 71,091 | -4.99 | 1,331 | -10.92 | ||||
| 2025-07-16 | 13F | Eagle Global Advisors Llc | 25,800 | 0.00 | 483 | -6.23 | ||||
| 2025-08-14 | 13F | Hrt Financial Lp | 176,399 | 122.95 | 3 | 200.00 | ||||
| 2025-08-14 | 13F | Cubist Systematic Strategies, LLC | 112,007 | -7.79 | 2,097 | -13.53 | ||||
| 2025-08-13 | 13F | Renaissance Technologies Llc | 35,620 | 141.26 | 667 | 126.53 | ||||
| 2025-08-19 | 13F | State of Wyoming | 0 | -100.00 | 0 | |||||
| 2025-08-14 | 13F | Schonfeld Strategic Advisors LLC | 0 | -100.00 | 0 | |||||
| 2025-08-18 | 13F/A | National Bank Of Canada /fi/ | 5,100 | 95 | ||||||
| 2025-08-08 | 13F | Accredited Investors Inc. | 20,000 | 100.00 | 374 | 87.94 | ||||
| 2025-08-06 | 13F | Commonwealth Equity Services, Llc | 28,802 | 4.09 | 1 | |||||
| 2025-08-14 | 13F | Point72 (DIFC) Ltd | 300 | 6 | ||||||
| 2025-07-28 | 13F | Naviter Wealth, LLC | 180,325 | 3.45 | 3,465 | -3.86 | ||||
| 2025-07-31 | 13F | Cambridge Investment Research Advisors, Inc. | 11,405 | -16.89 | 0 | |||||
| 2025-07-21 | 13F | Catalina Capital Group, LLC | 16,098 | 301 | ||||||
| 2025-08-12 | 13F | Steward Partners Investment Advisory, Llc | 3,250 | 225.00 | 61 | 215.79 | ||||
| 2025-08-14 | 13F | Rivernorth Capital Management, Llc | 207,172 | 3,878 | ||||||
| 2025-08-14 | 13F | Wells Fargo & Company/mn | 314,068 | 4.94 | 5,879 | -1.57 | ||||
| 2025-08-08 | 13F | Hartland & Co., LLC | 23,386 | 0.00 | 438 | -6.22 | ||||
| 2025-08-14 | 13F | Ameriprise Financial Inc | 43,585 | 2.40 | 761 | -10.69 | ||||
| 2025-08-13 | 13F | Northern Trust Corp | 30,154 | 154.66 | 564 | 138.98 | ||||
| 2025-08-07 | 13F | Samalin Investment Counsel, LLC | 11,547 | 1.75 | 216 | -4.42 | ||||
| 2025-08-12 | 13F | Proequities, Inc. | 0 | 0 | ||||||
| 2025-08-14 | 13F | Federation des caisses Desjardins du Quebec | 5,245 | 1.47 | 98 | -4.85 | ||||
| 2025-09-04 | 13F/A | Advisor Group Holdings, Inc. | 33,145 | -4.32 | 620 | -10.27 | ||||
| 2025-07-14 | 13F | AdvisorNet Financial, Inc | 4,200 | 27.27 | 79 | 20.00 | ||||
| 2025-08-07 | 13F | Fountainhead AM, LLC | 59,231 | 0.35 | 1,109 | -5.94 | ||||
| 2025-08-13 | 13F | Fiduciary Group LLC | 10,629 | 199 | ||||||
| 2025-07-31 | 13F | MQS Management LLC | 29,732 | 557 | ||||||
| 2025-08-15 | 13F | Morgan Stanley | 15,613,961 | 1.25 | 292,293 | -5.04 | ||||
| 2025-07-30 | 13F | D.a. Davidson & Co. | 40,731 | 66.43 | 762 | 56.15 | ||||
| 2025-08-15 | 13F | Captrust Financial Advisors | 49,345 | 1.82 | 924 | -4.55 | ||||
| 2025-05-15 | 13F | Centiva Capital, LP | 0 | -100.00 | 0 | |||||
| 2025-06-30 | NP | PSP - Invesco Global Listed Private Equity ETF This fund is a listed as child fund of Invesco Ltd. and if that institution has disclosed ownership in this security, then these positions will not be double counted when calculating total shares and total value | 30,072 | -15.05 | 586 | -21.27 | ||||
| 2025-08-12 | 13F | Jpmorgan Chase & Co | 73,723 | -32.29 | 1,380 | -36.49 | ||||
| 2025-07-01 | 13F | Confluence Investment Management Llc | 86,943 | 222.96 | 1,628 | 202.98 | ||||
| 2025-07-18 | 13F | Truist Financial Corp | 40,195 | 72.90 | 752 | 62.07 | ||||
| 2025-08-14 | 13F | BI Asset Management Fondsmaeglerselskab A/S | 28,845 | 33.39 | 1 | |||||
| 2025-08-08 | 13F | Cetera Investment Advisers | 26,180 | 83.63 | 490 | 72.54 | ||||
| 2025-08-04 | 13F | Creative Financial Designs Inc /adv | 3,555 | 0.00 | 67 | -5.71 | ||||
| 2025-07-02 | 13F/A | Bank Of Nova Scotia | 0 | -100.00 | 0 | -100.00 | ||||
| 2025-05-15 | 13F | D. E. Shaw & Co., Inc. | 0 | -100.00 | 0 | |||||
| 2025-08-14 | 13F | Jane Street Group, Llc | 138,785 | 2,598 |