Statistik Asas
| Pemilik Institusi | 276 total, 256 long only, 5 short only, 15 long/short - change of 2.60% MRQ |
| Purata Peruntukan Portfolio | 0.1853 % - change of -36.03% MRQ |
| Saham Institusi (Panjang) | 23,801,961 (ex 13D/G) - change of 2.13MM shares 9.81% MRQ |
| Nilai Institusi (Panjang) | $ 1,360,167 USD ($1000) |
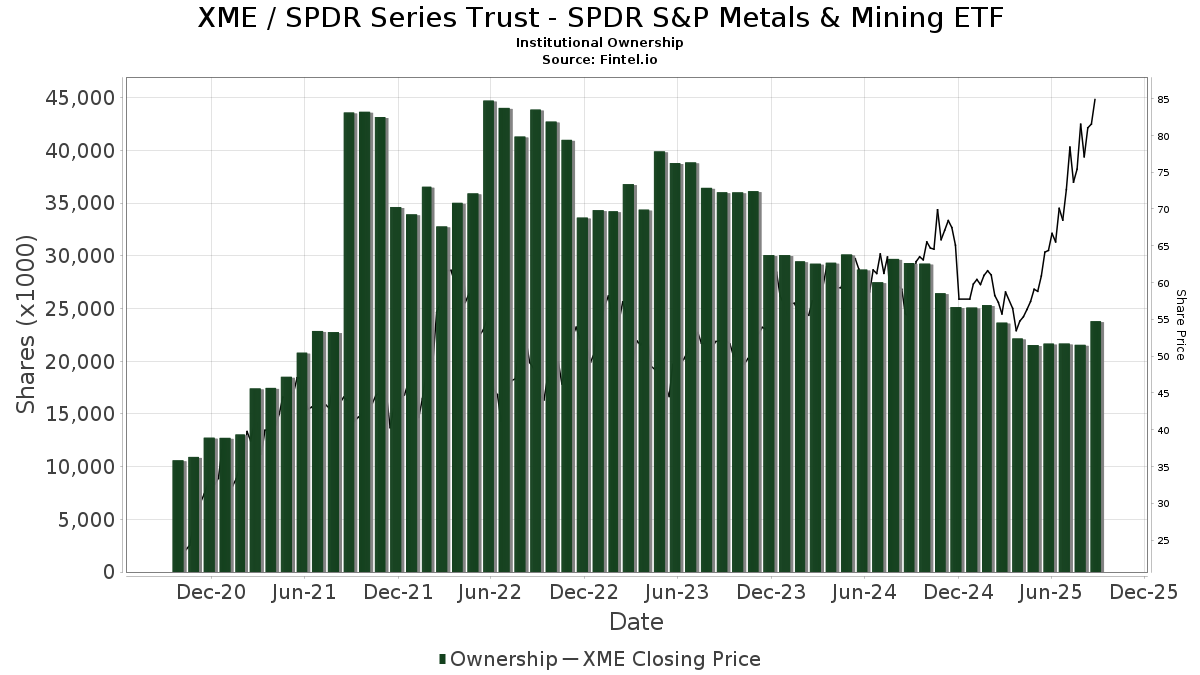
Pemilikan Institusi dan Pemegang Saham
SPDR Series Trust - SPDR S&P Metals & Mining ETF (US:XME) telah 276 pemilik institusi dan pemegang saham yang telah memfailkan borang 13D/G atau 13F dengan Suruhanjaya Bursa Sekuriti (SEC). Institusi ini memegang sejumlah 23,815,747 saham. Pemegang saham terbesar termasuk Elliott Investment Management L.P., Menora Mivtachim Holdings Ltd., Bank Of America Corp /de/, Morgan Stanley, Jpmorgan Chase & Co, Jane Street Group, Llc, UBS Group AG, Barclays Plc, Goldman Sachs Group Inc, and Clal Insurance Enterprises Holdings Ltd .
SPDR Series Trust - SPDR S&P Metals & Mining ETF (ARCA:XME) struktur pemilikan institusi menunjukkan kedudukan semasa dalam syarikat mengikut institusi dan dana serta perubahan terkini dalam saiz kedudukan. Pemegang saham utama boleh termasuk pelabur individu, dana amanah, dana lindung nilai atau institusi. Jadual 13D menunjukkan bahawa pelabur memegang (atau menahan) lebih daripada 5% syarikat dan berhasrat (atau berniat) untuk secara aktif meneruskan perubahan dalam strategi perniagaan. Jadual 13G menunjukkan pelaburan pasif melebihi 5%.
The share price as of September 5, 2025 is 83.93 / share. Previously, on September 6, 2024, the share price was 54.20 / share. This represents an increase of 54.85% over that period.
Skor Sentimen Dana
Skor Sentimen Dana (Skor Pengumpulan Pemilikan fka) mencari saham yang paling banyak dibeli oleh dana. Ia adalah hasil daripada model kuantitatif pelbagai faktor yang canggih yang mengenal pasti syarikat dengan tahap pengumpulan institusi tertinggi. Model pemarkahan ini menggunakan gabungan jumlah kenaikan dalam pemilik yang didedahkan, perubahan dalam peruntukan portfolio dalam pemilik tersebut dan metrik lain. Nombornya berjulat dari 0 hingga 100, dengan nombor yang lebih tinggi menunjukkan tahap pengumpulan yang lebih tinggi kepada rakannya, dan 50 adalah nombor purata.
Kekerapan Kemas Kini: Harian
Lihat Peneroka Pemilikan yang menyediakan senarai syarikat yang mempunyai kedudukan tertinggi.
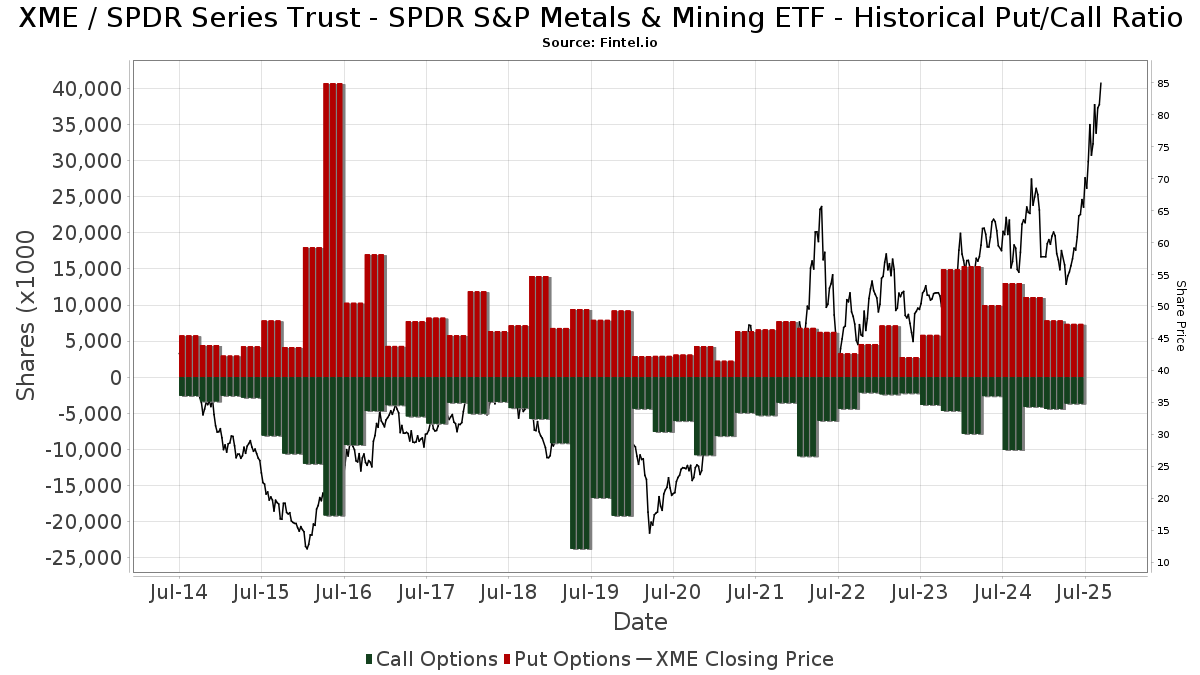
Nisbah Put/Call Institusi
Selain melaporkan isu ekuiti dan hutang standard, institusi yang mempunyai lebih daripada 100MM aset di bawah pengurusan juga mesti mendedahkan pegangan opsyen jual dan beli mereka. Memandangkan opsyen jual secara amnya menunjukkan sentimen negatif, dan opsyen beli menunjukkan sentimen positif, kita boleh mendapatkan gambaran keseluruhan sentimen institusi dengan merencanakan nisbah jual kepada beli. Carta di sebelah kanan memplotkan nisbah jual/beli sejarah untuk instrumen ini.
Menggunakan Nisbah Put/Callsebagai penunjuk sentimen pelabur mengatasi salah satu kekurangan utama menggunakan jumlah pemilikan institusi, iaitu sejumlah besar aset di bawah pengurusan dilaburkan secara pasif untuk menjejaki indeks. Dana yang diurus secara pasif biasanya tidak membeli opsyen, jadi penunjuk nisbah put/call mengekori rapat sentimen dana yang diurus secara aktif.
Pemfailan 13F dan NPORT
Butiran mengenai pemfailan 13F adalah percuma. Perincian mengenai pemfailan NP memerlukan keahlian premium. Baris hijau menunjukkan kedudukan baharu. Baris merah menunjukkan kedudukan tertutup. Klik pautan ikon untuk melihat sejarah transaksi penuh.
Naik Taraf
untuk membuka data premium dan mengeksport ke Excel ![]() .
.
| Tarikh Fail | Sumber | Pelabur | Jenis | Purata Harga (Ang) |
Saham | ΔSaham (%) |
Nilai Dilaporkan ($1000) |
Δ Nilai (%) |
Peruntukan Port (%) |
|
|---|---|---|---|---|---|---|---|---|---|---|
| 2025-07-25 | 13F | Sequoia Financial Advisors, LLC | 12,362 | -1.70 | 831 | 17.90 | ||||
| 2025-05-07 | 13F | Nemes Rush Group LLC | 0 | -100.00 | 0 | |||||
| 2025-08-08 | 13F | Creative Planning | 5,915 | 398 | ||||||
| 2025-08-14 | 13F | Hrt Financial Lp | 5,263 | 9.35 | 0 | |||||
| 2025-07-22 | 13F | IMC-Chicago, LLC | 12,205 | 820 | ||||||
| 2025-05-15 | 13F | Barclays Plc | Put | 0 | -100.00 | 0 | -100.00 | |||
| 2025-08-12 | 13F | Steward Partners Investment Advisory, Llc | 2,016 | -19.23 | 136 | -2.88 | ||||
| 2025-07-29 | 13F | Sigma Investment Counselors Inc | 6,403 | 71.29 | 430 | 105.74 | ||||
| 2025-08-04 | 13F | Creekmur Asset Management LLC | 247 | 17 | ||||||
| 2025-07-21 | 13F | Vanderbilt University | 971,339 | 0.15 | 65,293 | 20.24 | ||||
| 2025-08-14 | 13F | Graham Capital Management, L.P. | 90,000 | -36.62 | 6,050 | -23.91 | ||||
| 2025-07-28 | 13F | BRYN MAWR TRUST Co | 265 | 0.00 | 18 | 21.43 | ||||
| 2025-08-14 | 13F | Ancora Advisors, LLC | 1,105 | 0.00 | 74 | 21.31 | ||||
| 2025-07-17 | 13F | Fifth Third Securities, Inc. | 35,371 | -52.44 | 2,378 | -42.92 | ||||
| 2025-05-15 | 13F | Centiva Capital, LP | Call | 0 | -100.00 | 0 | ||||
| 2025-07-24 | 13F | IFP Advisors, Inc | 18,068 | -13.00 | 1,215 | 4.48 | ||||
| 2025-05-14 | 13F | Caitlin John, LLC | 0 | -100.00 | 0 | |||||
| 2025-08-13 | 13F | Capital Fund Management S.a. | Call | 0 | -100.00 | 0 | -100.00 | |||
| 2025-05-15 | 13F | Quantessence Capital LLC | 0 | -100.00 | 0 | |||||
| 2025-08-14 | 13F | Private Wealth Advisors, LLC | 52,993 | 1.26 | 3,562 | 21.57 | ||||
| 2025-07-30 | 13F | St. Johns Investment Management Company, LLC | 323 | 0.00 | 22 | 16.67 | ||||
| 2025-08-04 | 13F | Spire Wealth Management | 878 | -7.38 | 59 | 11.32 | ||||
| 2025-07-16 | 13F | BOS Asset Management, LLC | 16,414 | 0.92 | 1,103 | 21.21 | ||||
| 2025-08-13 | 13F | Bank Of Nova Scotia | 3,832 | -58.40 | 258 | -50.10 | ||||
| 2025-08-14 | 13F | Stifel Financial Corp | 19,826 | 8.31 | 1,333 | 30.08 | ||||
| 2025-08-18 | 13F/A | National Bank Of Canada /fi/ | 6,059 | 284.21 | 407 | 366.67 | ||||
| 2025-07-29 | 13F | Stratos Wealth Advisors, LLC | 3,710 | -2.60 | 249 | 16.90 | ||||
| 2025-08-13 | 13F | Providence Capital Advisors, LLC | 368 | 25 | ||||||
| 2025-04-29 | 13F | Riggs Asset Managment Co. Inc. | 0 | -100.00 | 0 | |||||
| 2025-08-05 | 13F | Simplex Trading, Llc | 0 | -100.00 | 0 | |||||
| 2025-07-28 | 13F | Kiker Wealth Management, LLC | 152 | -39.68 | 10 | -28.57 | ||||
| 2025-08-13 | 13F | Continuum Advisory, LLC | 0 | -100.00 | 0 | |||||
| 2025-08-14 | 13F | Bank Of America Corp /de/ | Put | 500,000 | -29.48 | 33,610 | -15.33 | |||
| 2025-05-15 | 13F | Barclays Plc | Call | 0 | -100.00 | 0 | -100.00 | |||
| 2025-08-14 | 13F | Bank Of America Corp /de/ | 2,287,663 | -1.57 | 153,777 | 18.18 | ||||
| 2025-08-14 | 13F | BancorpSouth Bank | 3,000 | 202 | ||||||
| 2025-05-15 | 13F | Balyasny Asset Management Llc | Put | 0 | -100.00 | 0 | -100.00 | |||
| 2025-08-13 | 13F | Natixis | 802,788 | 0.00 | 53,963 | 21.47 | ||||
| 2025-08-08 | 13F | Avantax Advisory Services, Inc. | 3,382 | 227 | ||||||
| 2025-08-13 | 13F | Walleye Capital LLC | Put | 1,200 | 0.00 | 81 | 19.40 | |||
| 2025-08-13 | 13F | Walleye Capital LLC | 2,735 | -61.07 | 184 | -53.44 | ||||
| 2025-08-14 | 13F | Jain Global LLC | 26,387 | 1,774 | ||||||
| 2025-05-09 | 13F | MWA Asset Management | 0 | -100.00 | 0 | |||||
| 2025-07-15 | 13F | Compagnie Lombard Odier SCmA | 28,200 | 0.00 | 1,896 | 20.09 | ||||
| 2025-08-13 | 13F | Ted Buchan & Co | 90,516 | 6.00 | 6,084 | 27.28 | ||||
| 2025-08-15 | 13F | Kestra Advisory Services, LLC | 11,295 | -89.87 | 759 | -87.83 | ||||
| 2025-08-14 | 13F | Colony Group, LLC | 9,058 | 0.02 | 609 | 19.92 | ||||
| 2025-08-14 | 13F | SummitTX Capital, L.P. | 0 | -100.00 | 0 | |||||
| 2025-07-17 | 13F | Vermillion Wealth Management, Inc. | 11,360 | 8.87 | 764 | 30.65 | ||||
| 2025-08-04 | 13F | Atria Investments Llc | 0 | -100.00 | 0 | |||||
| 2025-07-15 | 13F | McAdam, LLC | 3,997 | 0.73 | 269 | 20.72 | ||||
| 2025-07-23 | 13F | Meitav Dash Investments Ltd | 8,614 | 0.00 | 579 | 20.12 | ||||
| 2025-07-09 | 13F | Fermata Advisors, LLC | 10,126 | -12.09 | 681 | 5.59 | ||||
| 2025-07-15 | 13F | Main Street Group, LTD | 400 | 0.00 | 27 | 18.18 | ||||
| 2025-08-13 | 13F | Fisher Asset Management, LLC | 28,288 | 64.58 | 1,902 | 97.61 | ||||
| 2025-08-04 | 13F | Arkadios Wealth Advisors | 3,023 | 203 | ||||||
| 2025-08-13 | 13F | Flow Traders U.s. Llc | 0 | -100.00 | 0 | |||||
| 2025-08-14 | 13F | Integrated Wealth Concepts LLC | 9,383 | -20.08 | 631 | -4.11 | ||||
| 2025-08-14 | 13F | Daiwa Securities Group Inc. | 20,780 | -13.70 | 1 | 0.00 | ||||
| 2025-05-08 | 13F | Capital Management Associates /ny/ | 0 | -100.00 | 0 | -100.00 | ||||
| 2025-08-15 | 13F | Tower Research Capital LLC (TRC) | 102,927 | 112.73 | 6,919 | 157.65 | ||||
| 2025-04-23 | 13F | GenTrust, LLC | 0 | -100.00 | 0 | |||||
| 2025-08-14 | 13F | Macquarie Group Ltd | 0 | -100.00 | 0 | -100.00 | ||||
| 2025-08-12 | 13F | TCTC Holdings, LLC | 7,695 | 0.00 | 517 | 20.23 | ||||
| 2025-08-14 | 13F | Scopus Asset Management, L.p. | Put | 246,200 | -45.29 | 16,550 | -34.32 | |||
| 2025-08-14 | 13F | Quarry LP | 8,000 | 538 | ||||||
| 2025-08-12 | 13F | Jpmorgan Chase & Co | 1,959,322 | 2,642.04 | 131,706 | 3,192.63 | ||||
| 2025-08-01 | 13F | Y-Intercept (Hong Kong) Ltd | 21,750 | 1,462 | ||||||
| 2025-08-14 | 13F | GWM Advisors LLC | 2,579 | 0.00 | 173 | 20.14 | ||||
| 2025-08-14 | 13F | Volterra Technologies LP | 145,333 | 9,769 | ||||||
| 2025-04-21 | 13F | Cadent Capital Advisors, LLC | 0 | -100.00 | 0 | |||||
| 2025-07-15 | 13F | Heritage Oak Wealth Advisors Llc | 37,711 | -0.42 | 2,535 | 19.53 | ||||
| 2025-08-11 | 13F | Capital Square, LLC | 5,098 | 21.24 | 373 | 58.30 | ||||
| 2025-07-21 | 13F | Mirae Asset Global Investments Co., Ltd. | 3,250 | 218 | ||||||
| 2025-08-11 | 13F | Citigroup Inc | Put | 0 | -100.00 | 0 | -100.00 | |||
| 2025-07-22 | 13F | SOL Capital Management CO | 3,000 | 0 | ||||||
| 2025-05-15 | 13F | Newbridge Financial Services Group, Inc. | 0 | -100.00 | 0 | |||||
| 2025-08-06 | 13F | Legacy Investment Solutions, LLC | 250 | 0.00 | 17 | 6.67 | ||||
| 2025-05-13 | 13F | Wells Fargo & Company/mn | Put | 0 | -100.00 | 0 | -100.00 | |||
| 2025-08-14 | 13F | BTG Pactual Asset Management US LLC | 0 | -100.00 | 0 | |||||
| 2025-08-14 | 13F | Marshall Investment Management, Llc | 0 | -100.00 | 0 | |||||
| 2025-07-08 | 13F | Parallel Advisors, LLC | 2 | 0.00 | 0 | |||||
| 2025-07-11 | 13F | Farther Finance Advisors, LLC | 5,441 | -6.29 | 366 | 12.65 | ||||
| 2025-08-13 | 13F | OMERS ADMINISTRATION Corp | 0 | -100.00 | 0 | |||||
| 2025-07-17 | 13F | Venture Visionary Partners LLC | 5,696 | -0.44 | 383 | 19.38 | ||||
| 2025-08-11 | 13F | Private Advisor Group, LLC | 32,430 | -11.69 | 2,180 | 5.98 | ||||
| 2025-04-25 | 13F | New Wave Wealth Advisors Llc | 0 | -100.00 | 0 | |||||
| 2025-08-12 | 13F | AlphaCore Capital LLC | 351 | 24 | ||||||
| 2025-08-08 | 13F | Meridian Wealth Management, LLC | 10,370 | 24.80 | 697 | 49.89 | ||||
| 2025-08-04 | 13F | Pensionmark Financial Group, Llc | 3,329 | 224 | ||||||
| 2025-08-26 | 13F/A | Thrivent Financial For Lutherans | 0 | -100.00 | 0 | |||||
| 2025-08-14 | 13F | Federation des caisses Desjardins du Quebec | 1,658 | 0.00 | 111 | 20.65 | ||||
| 2025-08-14 | 13F | LMR Partners LLP | 0 | -100.00 | 0 | |||||
| 2025-08-14 | 13F | Brevan Howard Capital Management LP | 0 | -100.00 | 0 | |||||
| 2025-08-11 | 13F | Empowered Funds, LLC | 37,031 | 2,489 | ||||||
| 2025-08-14 | 13F | Aster Capital Management (DIFC) Ltd | 0 | -100.00 | 0 | |||||
| 2025-05-16 | 13F | Jones Financial Companies Lllp | 0 | -100.00 | 0 | |||||
| 2025-07-28 | 13F | Pettinga Financial Advisors, LLC | 14,384 | 2.42 | 967 | 22.90 | ||||
| 2025-07-30 | 13F | Strategic Blueprint, LLC | 6,986 | 3.45 | 470 | 24.07 | ||||
| 2025-05-16 | 13F | Sender Co & Partners, Inc. | 0 | -100.00 | 0 | |||||
| 2025-08-14 | 13F | Jane Street Group, Llc | Call | 209,600 | -42.08 | 14,089 | -30.47 | |||
| 2025-08-14 | 13F | Jane Street Group, Llc | Put | 1,582,200 | 34.24 | 106,355 | 61.17 | |||
| 2025-08-04 | 13F | JDM Financial Group LLC | 66 | 4 | ||||||
| 2025-08-12 | 13F | J.w. Cole Advisors, Inc. | 4,880 | 328 | ||||||
| 2025-05-01 | 13F | Coastal Investment Advisors, Inc. | 0 | -100.00 | 0 | -100.00 | ||||
| 2025-08-06 | 13F | Commonwealth Equity Services, Llc | 45,136 | -1.19 | 3 | 50.00 | ||||
| 2025-08-14 | 13F | DRW Securities, LLC | Call | 0 | -100.00 | 0 | -100.00 | |||
| 2025-05-14 | 13F | Trexquant Investment LP | 0 | -100.00 | 0 | -100.00 | ||||
| 2025-08-06 | 13F | Pekin Hardy Strauss, Inc. | 26,564 | -7.22 | 1,786 | 11.42 | ||||
| 2025-08-08 | 13F | Emerald Investment Partners, Llc | 90 | 0.00 | 6 | 20.00 | ||||
| 2025-08-12 | 13F | Choate Investment Advisors | 2,911 | 196 | ||||||
| 2025-08-01 | 13F | Envestnet Asset Management Inc | 25,695 | 20.29 | 1,727 | 44.52 | ||||
| 2025-04-28 | 13F | Fedenia Advisers LLC | 0 | -100.00 | 0 | |||||
| 2025-07-28 | 13F | Private Wealth Asset Management, LLC | 450 | 30 | ||||||
| 2025-07-22 | 13F | Comprehensive Financial Consultants Institutional, Inc. | 7,154 | 17.01 | 481 | 40.35 | ||||
| 2025-08-11 | 13F | Rpo Llc | 0 | -100.00 | 0 | |||||
| 2025-08-13 | 13F | RPg Family Wealth Advisory, LLC | 12,699 | 1.36 | 854 | 21.68 | ||||
| 2025-08-13 | 13F | Everstar Asset Management, LLC | 13,021 | -40.05 | 875 | -28.04 | ||||
| 2025-07-30 | NP | EMPB - Efficient Market Portfolio Plus ETF | Short | -13,786 | -181.87 | -829 | -184.66 | |||
| 2025-08-11 | 13F | Rpo Llc | Put | 0 | -100.00 | 0 | ||||
| 2025-07-29 | 13F | Oxbow Advisors, LLC | 4,075 | 0.00 | 274 | 19.74 | ||||
| 2025-08-01 | 13F | Jennison Associates Llc | 81,590 | -20.15 | 5,484 | -4.14 | ||||
| 2025-08-05 | 13F | Integrity Financial Corp /WA | 18 | 0.00 | 1 | 0.00 | ||||
| 2025-08-11 | 13F | Rpo Llc | Call | 0 | -100.00 | 0 | ||||
| 2025-08-14 | 13F | Susquehanna International Group, Llp | 73,795 | -17.32 | 4,960 | -0.74 | ||||
| 2025-08-13 | 13F | Capital Fund Management S.a. | Put | 21,300 | -83.59 | 1,432 | -80.31 | |||
| 2025-05-15 | 13F | Marshall Wace, Llp | Call | 0 | -100.00 | 0 | -100.00 | |||
| 2025-08-06 | 13F | Tradewinds, LLC. | 0 | -100.00 | 0 | |||||
| 2025-05-15 | 13F | Balyasny Asset Management Llc | Call | 0 | -100.00 | 0 | -100.00 | |||
| 2025-08-08 | 13F | Citizens Financial Group Inc/ri | 13,401 | 0.13 | 901 | 20.16 | ||||
| 2025-08-13 | 13F | Lido Advisors, LLC | 3,110 | 209 | ||||||
| 2025-08-14 | 13F | Susquehanna International Group, Llp | Call | 256,300 | -48.26 | 17,228 | -37.89 | |||
| 2025-08-14 | 13F | Susquehanna International Group, Llp | Put | 454,500 | -6.46 | 30,551 | 12.30 | |||
| 2025-08-12 | 13F | Jaffetilchin Investment Partners, LLC | 54,010 | 1.05 | 3,631 | 21.32 | ||||
| 2025-08-07 | 13F/A | Credit Industriel Et Commercial | 5,277 | -52.76 | 355 | -43.36 | ||||
| 2025-08-12 | 13F | Proequities, Inc. | 0 | 0 | ||||||
| 2025-08-15 | 13F | Equitable Holdings, Inc. | 6,058 | 0.48 | 407 | 20.77 | ||||
| 2025-08-13 | 13F | Renaissance Technologies Llc | 10,300 | 692 | ||||||
| 2025-07-30 | 13F | Whittier Trust Co | 788 | 0.00 | 53 | 18.18 | ||||
| 2025-08-07 | 13F/A | Credit Industriel Et Commercial | Put | 60,000 | 0.00 | 4,033 | 20.07 | |||
| 2025-07-07 | 13F | Roxbury Financial LLC | 143 | -17.82 | 10 | -10.00 | ||||
| 2025-07-25 | 13F | Almanack Investment Partners, LLC. | 8,985 | -2.62 | 604 | 16.86 | ||||
| 2025-08-14 | 13F | Capstone Investment Advisors, Llc | Call | 373,600 | 20.01 | 25,113 | 44.09 | |||
| 2025-08-14 | 13F | Capstone Investment Advisors, Llc | Put | 373,600 | 20.01 | 25,113 | 44.09 | |||
| 2025-07-16 | 13F | Strategic Investment Solutions, Inc. /IL | 515 | 0.19 | 35 | 21.43 | ||||
| 2025-08-15 | 13F | Morgan Stanley | 2,128,083 | 2.91 | 143,050 | 23.56 | ||||
| 2025-08-14 | 13F | LaSalle St. Investment Advisors, LLC | 10,367 | 6.21 | 1 | |||||
| 2025-08-14 | 13F | Elliott Investment Management L.P. | Put | 2,850,000 | 111.11 | 191,577 | 153.46 | |||
| 2025-08-14 | 13F | Capstone Investment Advisors, Llc | 21,453 | -89.06 | 1,442 | -86.87 | ||||
| 2025-08-12 | 13F | Fortem Financial Group, Llc | 105,040 | 6.37 | 7,061 | 27.69 | ||||
| 2025-08-05 | 13F | EPG Wealth Management LLC | 1,079 | 0.09 | 73 | 20.00 | ||||
| 2025-08-14 | 13F | Nomura Holdings Inc | Call | 0 | -100.00 | 0 | ||||
| 2025-08-14 | 13F | Qube Research & Technologies Ltd | 0 | -100.00 | 0 | |||||
| 2025-07-30 | 13F | Cullen/frost Bankers, Inc. | 1,483 | 0.00 | 100 | 19.28 | ||||
| 2025-08-04 | 13F | Hantz Financial Services, Inc. | 39 | 0 | ||||||
| 2025-08-11 | 13F | Brown Brothers Harriman & Co | 1,251 | 0.00 | 84 | 20.00 | ||||
| 2025-07-31 | 13F | 180 Wealth Advisors, Llc | 36,817 | 6.25 | 2,475 | 27.53 | ||||
| 2025-09-04 | 13F/A | Advisor Group Holdings, Inc. | 117,677 | -49.23 | 7,912 | -39.06 | ||||
| 2025-07-25 | 13F | We Are One Seven, LLC | 6,245 | 6.97 | 420 | 28.53 | ||||
| 2025-08-08 | 13F | Pnc Financial Services Group, Inc. | 69,233 | -7.56 | 4,654 | 10.97 | ||||
| 2025-08-11 | 13F | ARS Investment Partners, LLC | 67,968 | -20.09 | 4,569 | -5.37 | ||||
| 2025-07-16 | 13F/A | CX Institutional | 6,041 | 0 | ||||||
| 2025-08-07 | 13F | PFG Advisors | 29,177 | 353.98 | 1,961 | 446.24 | ||||
| 2025-08-12 | 13F | Jefferies Financial Group Inc. | 0 | -100.00 | 0 | |||||
| 2025-08-14 | 13F | Polymer Capital Management (US) LLC | Put | 0 | -100.00 | 0 | ||||
| 2025-08-04 | 13F | Assetmark, Inc | 430 | 0.00 | 29 | 16.67 | ||||
| 2025-04-30 | 13F | Yong Rong (HK) Asset Management Ltd | 0 | -100.00 | 0 | |||||
| 2025-08-04 | 13F | Silver Coast Investments LLC | 47,790 | -12.57 | 3,212 | 4.97 | ||||
| 2025-08-06 | 13F | Maltin Wealth Management, Inc. | 0 | -100.00 | 0 | |||||
| 2025-08-11 | 13F | Insight 2811, Inc. | 6,222 | 0.00 | 418 | 20.11 | ||||
| 2025-07-25 | 13F | NorthRock Partners, LLC | 0 | -100.00 | 0 | |||||
| 2025-05-14 | 13F | Capital Fund Management S.a. | 0 | -100.00 | 0 | -100.00 | ||||
| 2025-08-14 | 13F | Bnp Paribas Arbitrage, Sa | 201,328 | -35.58 | 13,533 | -22.66 | ||||
| 2025-05-15 | 13F | D. E. Shaw & Co., Inc. | 0 | -100.00 | 0 | |||||
| 2025-07-09 | 13F | Dynamic Advisor Solutions LLC | 46,979 | 53.99 | 3,158 | 84.84 | ||||
| 2025-08-07 | 13F | Evoke Wealth, Llc | 22,836 | 0.09 | 1,535 | 20.20 | ||||
| 2025-08-12 | 13F | O'shaughnessy Asset Management, Llc | 331 | -1.49 | 22 | 22.22 | ||||
| 2025-08-14 | 13F | EHP Funds Inc. | 23,800 | -48.48 | 1,600 | -38.17 | ||||
| 2025-08-13 | 13F | Hsbc Holdings Plc | 0 | -100.00 | 0 | |||||
| 2025-08-12 | 13F | Calton & Associates, Inc. | 17,445 | -2.32 | 1,173 | 17.32 | ||||
| 2025-08-08 | 13F | Kingsview Wealth Management, LLC | 5,637 | 379 | ||||||
| 2025-08-07 | 13F | Resources Investment Advisors, LLC. | 11,973 | -2.88 | 805 | 16.52 | ||||
| 2025-08-14 | 13F | Bnp Paribas Arbitrage, Sa | Put | 4,313 | 73.84 | 28,992 | 108.70 | |||
| 2025-08-14 | 13F | Bnp Paribas Arbitrage, Sa | Call | 750 | 0.00 | 5,042 | 20.05 | |||
| 2025-05-14 | 13F | Strategies Wealth Advisors, LLC | 0 | -100.00 | 0 | -100.00 | ||||
| 2025-07-01 | 13F | Harbor Investment Advisory, Llc | 60 | 0.00 | 4 | 33.33 | ||||
| 2025-08-11 | 13F | HighTower Advisors, LLC | 319,823 | -12.36 | 21,499 | 5.22 | ||||
| 2025-07-10 | 13F | Wealth Enhancement Advisory Services, Llc | 5,003 | 2.06 | 351 | 27.74 | ||||
| 2025-08-14 | 13F | Hilltop Holdings Inc. | 28,397 | 1,909 | ||||||
| 2025-08-04 | 13F | Econ Financial Services Corp | 0 | -100.00 | 0 | |||||
| 2025-07-31 | 13F | Cambridge Investment Research Advisors, Inc. | 61,125 | -0.14 | 4 | 33.33 | ||||
| 2025-08-13 | 13F | Northwestern Mutual Wealth Management Co | 8,576 | -79.24 | 576 | -75.09 | ||||
| 2025-07-15 | 13F | Herbst Group, Llc | 71,452 | -4.39 | 4,803 | 14.77 | ||||
| 2025-07-17 | 13F | Independence Bank of Kentucky | 545 | 0.00 | 37 | 20.00 | ||||
| 2025-08-14 | 13F | Caption Management, LLC | 38,800 | 2,608 | ||||||
| 2025-08-14 | 13F | Citadel Advisors Llc | Call | 109,000 | -28.66 | 7,327 | -14.37 | |||
| 2025-08-14 | 13F | MGB Wealth Management, LLC | 7,991 | 16.81 | 537 | 40.21 | ||||
| 2025-08-14 | 13F | Citadel Advisors Llc | 104,263 | -62.17 | 7,009 | -54.58 | ||||
| 2025-08-14 | 13F | Citadel Advisors Llc | Put | 276,900 | -41.50 | 18,613 | -29.76 | |||
| 2025-08-27 | NP | RLY - SPDR SSGA Multi-Asset Real Return ETF This fund is a listed as child fund of State Street Corp and if that institution has disclosed ownership in this security, then these positions will not be double counted when calculating total shares and total value | 263,561 | -25.18 | 17,717 | -10.17 | ||||
| 2025-07-31 | 13F | Wealthfront Advisers Llc | 40,184 | -2.05 | 2,701 | 17.59 | ||||
| 2025-08-07 | 13F | CENTRAL TRUST Co | 5,339 | -25.20 | 359 | -10.28 | ||||
| 2025-08-13 | 13F | Marshall Wace, Llp | 0 | -100.00 | 0 | |||||
| 2025-08-08 | 13F | WASHINGTON TRUST Co | 0 | -100.00 | 0 | |||||
| 2025-05-14 | 13F | Cravens & Co Advisors, LLC | 0 | -100.00 | 0 | |||||
| 2025-08-14 | 13F | Clark Capital Management Group, Inc. | 13,826 | 929 | ||||||
| 2025-08-13 | 13F | Transce3nd, LLC | 34 | 325.00 | 2 | |||||
| 2025-07-25 | 13F | Cwm, Llc | 17,769 | 59.28 | 1 | |||||
| 2025-08-08 | 13F | Cetera Investment Advisers | 78,510 | 62.88 | 5,277 | 95.59 | ||||
| 2025-08-12 | 13F | Integrated Advisors Network LLC | 5,360 | -38.86 | 360 | -26.53 | ||||
| 2025-05-15 | 13F | LMR Partners LLP | Call | 0 | -100.00 | 0 | -100.00 | |||
| 2025-08-12 | 13F | Laurel Wealth Advisors LLC | 3,361 | 6,622.00 | 0 | -100.00 | ||||
| 2025-08-14 | 13F | Peak6 Llc | Call | 29,300 | -70.31 | 1,970 | -64.37 | |||
| 2025-08-14 | 13F | Peak6 Llc | Put | 19,200 | -33.56 | 1,291 | -20.27 | |||
| 2025-08-05 | 13F | Wellington Shields Capital Management, LLC | 47,147 | -39.54 | 3,169 | -27.42 | ||||
| 2025-05-12 | 13F | Kohmann Bosshard Financial Services, LLC | 0 | -100.00 | 0 | |||||
| 2025-08-14 | 13F | Raymond James Financial Inc | 346,691 | -5.12 | 23,305 | 13.91 | ||||
| 2025-04-24 | 13F | Overbrook Management Corp | 0 | -100.00 | 0 | |||||
| 2025-08-14 | 13F | IHT Wealth Management, LLC | 23,054 | -2.19 | 1,550 | 17.44 | ||||
| 2025-07-23 | 13F | Citizens National Bank Trust Department | 500 | 0.00 | 34 | 22.22 | ||||
| 2025-08-07 | 13F | Amica Retiree Medical Trust | 646 | 0.00 | 0 | |||||
| 2025-08-14 | 13F | Goldman Sachs Group Inc | Call | 416,200 | 1,981.00 | 27,977 | 2,400.09 | |||
| 2025-04-17 | 13F | FNY Investment Advisers, LLC | 0 | -100.00 | 0 | |||||
| 2025-08-14 | 13F | DRW Securities, LLC | 14,717 | -24.89 | 951 | -13.31 | ||||
| 2025-07-17 | 13F | Global Trust Asset Management, LLC | 400 | 27 | ||||||
| 2025-08-14 | 13F | Goldman Sachs Group Inc | Put | 0 | -100.00 | 0 | -100.00 | |||
| 2025-08-06 | 13F | Black Swift Group, LLC | 0 | -100.00 | 0 | |||||
| 2025-05-12 | 13F | Capital Wealth Planning, LLC | 0 | -100.00 | 0 | -100.00 | ||||
| 2025-07-21 | 13F | Ameritas Advisory Services, LLC | 1,231 | 83 | ||||||
| 2025-08-14 | 13F | Millennium Management Llc | 0 | -100.00 | 0 | -100.00 | ||||
| 2025-08-14 | 13F | Millennium Management Llc | Put | 90,000 | -67.86 | 6,050 | -61.41 | |||
| 2025-08-19 | 13F | Asset Dedication, LLC | 52 | 0.00 | 3 | 50.00 | ||||
| 2025-08-14 | 13F | Millennium Management Llc | Call | 306,000 | 96.15 | 20,569 | 135.50 | |||
| 2025-08-14 | 13F | Black Maple Capital Management LP | 10,500 | -50.00 | 706 | -40.00 | ||||
| 2025-08-14 | 13F | Goldman Sachs Group Inc | 1,237,854 | 24.02 | 83,209 | 48.90 | ||||
| 2025-07-25 | 13F | Atria Wealth Solutions, Inc. | 13,797 | -0.76 | 950 | 22.11 | ||||
| 2025-08-11 | 13F | Strategic Wealth Partners, Ltd. | 100 | 7 | ||||||
| 2025-08-14 | 13F | CIBC World Markets Inc. | 27,636 | -33.65 | 1,858 | -20.37 | ||||
| 2025-08-01 | 13F | Mizuho Markets Americas Llc | 3,869 | 260 | ||||||
| 2025-07-07 | 13F | Fox Hill Wealth Management | 10,579 | 0.65 | 711 | 20.92 | ||||
| 2025-07-21 | 13F | Synergy Financial Management, LLC | 3,399 | 228 | ||||||
| 2025-07-08 | 13F | Heartwood Wealth Advisors LLC | 25,766 | 0.14 | 1,732 | 20.21 | ||||
| 2025-08-08 | 13F | Larson Financial Group LLC | 313 | 0.00 | 21 | 23.53 | ||||
| 2025-08-14 | 13F | Snowden Capital Advisors LLC | 19,309 | -2.03 | 1,298 | 17.59 | ||||
| 2025-05-15 | 13F | LMR Partners LLP | Put | 0 | -100.00 | 0 | -100.00 | |||
| 2025-08-13 | 13F/A | StoneX Group Inc. | 0 | -100.00 | 0 | -100.00 | ||||
| 2025-08-14 | 13F | Comerica Bank | 9,445 | -6.86 | 635 | 11.82 | ||||
| 2025-05-14 | 13F | Garda Capital Partners Lp | 0 | -100.00 | 0 | -100.00 | ||||
| 2025-05-14 | 13F | Credit Agricole S A | 3,556 | 11.06 | 199 | 9.94 | ||||
| 2025-08-13 | 13F | Okabena Investment Services Inc | 65,387 | 0.00 | 4,395 | 20.05 | ||||
| 2025-08-14 | 13F | Condire Management, LP | 152,085 | 10,223 | ||||||
| 2025-04-15 | 13F | Parsons Capital Management Inc/ri | 0 | -100.00 | 0 | |||||
| 2025-08-14 | 13F | Pinnacle Family Advisors, LLC | 4,270 | 287 | ||||||
| 2025-08-14 | 13F | Stamos Capital Partners, L.p. | 24,501 | 26.42 | 1,647 | 51.71 | ||||
| 2025-08-12 | 13F | Global Retirement Partners, LLC | 3,364 | -0.41 | 226 | 18.32 | ||||
| 2025-08-14 | 13F | Greenline Partners, LLC | 41,840 | 8.03 | 2,812 | 29.70 | ||||
| 2025-08-11 | 13F | TD Waterhouse Canada Inc. | 21,250 | -0.93 | 1,425 | 19.05 | ||||
| 2025-08-07 | 13F | Amica Mutual Insurance Co | 6,490 | 0.00 | 0 | |||||
| 2025-08-14 | 13F | Two Sigma Securities, Llc | 0 | -100.00 | 0 | |||||
| 2025-08-14 | 13F | Harwood Advisory Group, LLC | 19,245 | 1.03 | 1,294 | 19.61 | ||||
| 2025-07-09 | 13F | FOCUS Wealth Advisors, LLC | 76,970 | 0.51 | 5,174 | 20.67 | ||||
| 2025-07-28 | 13F | Harbour Investments, Inc. | 25,741 | 1.42 | 1,730 | 21.75 | ||||
| 2025-08-12 | 13F | Main Management LLC | 2,000 | 0.00 | 0 | |||||
| 2025-08-18 | 13F | Wolverine Trading, Llc | Call | 21,500 | 1.42 | 1,427 | 18.92 | |||
| 2025-08-18 | 13F | Wolverine Trading, Llc | Put | 60,600 | -70.91 | 4,023 | -65.90 | |||
| 2025-08-18 | 13F | Wolverine Trading, Llc | 53,504 | -42.48 | 3,552 | -32.57 | ||||
| 2025-08-13 | 13F | Alerus Financial Na | 240 | 16 | ||||||
| 2025-07-28 | 13F | Twin Tree Management, LP | Call | 0 | -100.00 | 0 | ||||
| 2025-08-11 | 13F | Y.D. More Investments Ltd | 11,000 | 0.00 | 739 | 20.16 | ||||
| 2025-08-12 | 13F | Founders Financial Alliance, LLC | 0 | -100.00 | 0 | |||||
| 2025-08-14 | 13F/A | Barclays Plc | 1,360,998 | 22.92 | 91 | 49.18 | ||||
| 2025-07-09 | 13F | Reyes Financial Architecture, Inc. | 1,270 | 85 | ||||||
| 2025-08-12 | 13F | Clal Insurance Enterprises Holdings Ltd | 1,000,000 | -34.43 | 67 | -21.18 | ||||
| 2025-08-06 | 13F | Rialto Wealth Management, LLC | 1,806 | 0.00 | 121 | 19.80 | ||||
| 2025-08-29 | 13F | Evolution Wealth Management Inc. | 172 | 12 | ||||||
| 2025-08-06 | 13F | First Horizon Advisors, Inc. | 485 | 0.00 | 33 | 18.52 | ||||
| 2025-08-12 | 13F | Franklin Resources Inc | 275 | 0.00 | 18 | 20.00 | ||||
| 2025-08-27 | 13F/A | Squarepoint Ops LLC | 114,221 | 7,678 | ||||||
| 2025-08-14 | 13F | Ameriprise Financial Inc | 56,782 | 16.92 | 3,817 | 40.50 | ||||
| 2025-05-14 | 13F | Walleye Capital LLC | Call | 0 | -100.00 | 0 | -100.00 | |||
| 2025-05-15 | 13F | Twin Tree Management, LP | Put | 0 | -100.00 | 0 | -100.00 | |||
| 2025-08-27 | 13F/A | Squarepoint Ops LLC | Call | 9,800 | -92.93 | 659 | -91.52 | |||
| 2025-08-27 | 13F/A | Squarepoint Ops LLC | Put | 11,100 | -91.45 | 746 | -89.74 | |||
| 2025-07-24 | 13F | Ronald Blue Trust, Inc. | 300 | 0.00 | 20 | 25.00 | ||||
| 2025-08-14 | 13F | Sig Brokerage, Lp | Put | 267,500 | 2,575.00 | 17,981 | 3,116.64 | |||
| 2025-08-08 | 13F | SG Americas Securities, LLC | 58,034 | 7.62 | 4 | 0.00 | ||||
| 2025-08-07 | 13F | Allworth Financial LP | 3,315 | 0.00 | 223 | 17.46 | ||||
| 2025-08-14 | 13F | Operose Advisors LLC | 524 | -22.49 | 35 | -5.41 | ||||
| 2025-08-12 | 13F | Financial Advocates Investment Management | 0 | -100.00 | 0 | |||||
| 2025-07-09 | 13F | Triumph Capital Management | 3,943 | -24.04 | 265 | -8.62 | ||||
| 2025-07-31 | 13F | Sumitomo Mitsui Trust Holdings, Inc. | 12,000 | 807 | ||||||
| 2025-08-05 | 13F | Bank Of Montreal /can/ | 39,551 | 0.82 | 2,659 | 21.04 | ||||
| 2025-08-07 | 13F | Winch Advisory Services, LLC | 454 | 0.22 | 31 | 20.00 | ||||
| 2025-08-07 | 13F | Montag A & Associates Inc | 12,185 | -4.47 | 819 | 14.71 | ||||
| 2025-08-14 | 13F | Balyasny Asset Management Llc | 38,800 | 0.00 | 2,608 | 20.07 | ||||
| 2025-08-19 | 13F | Advisory Services Network, LLC | 10,209 | -7.12 | 749 | 21.63 | ||||
| 2025-08-05 | 13F | Carolinas Wealth Consulting Llc | 0 | -100.00 | 0 | -100.00 | ||||
| 2025-05-14 | 13F | HAP Trading, LLC | 0 | -100.00 | 0 | |||||
| 2025-08-13 | 13F | Scotia Capital Inc. | 39,651 | 2.85 | 2,665 | 23.49 | ||||
| 2025-07-30 | 13F | Eqis Capital Management, Inc. | 3,418 | -5.08 | 230 | 13.93 | ||||
| 2025-08-14 | 13F | Two Sigma Investments, Lp | 600,000 | 0.00 | 40,332 | 20.06 | ||||
| 2025-05-02 | 13F | Edgestream Partners, L.P. | 0 | -100.00 | 0 | -100.00 | ||||
| 2025-08-14 | 13F | MIRAE ASSET GLOBAL ETFS HOLDINGS Ltd. | 0 | -100.00 | 0 | |||||
| 2025-08-14 | 13F | Bank Of America Corp /de/ | Call | 0 | -100.00 | 0 | -100.00 | |||
| 2025-07-15 | 13F | Retirement Income Solutions, Inc | 10,349 | 0.00 | 696 | 20.03 | ||||
| 2025-08-08 | 13F | Allianz Se | 101,070 | 16.75 | 6,794 | 40.15 | ||||
| 2025-04-30 | 13F | CFC Planning Co LLC | 0 | -100.00 | 0 | |||||
| 2025-07-09 | 13F | Clarus Wealth Advisors | 25,218 | 1,730 | ||||||
| 2025-08-14 | 13F | Modern Wealth Management, LLC | 9,984 | -4.72 | 671 | 14.51 | ||||
| 2025-08-14 | 13F | Mariner, LLC | 17,017 | -4.17 | 1,144 | 14.99 | ||||
| 2025-07-29 | 13F | Regions Financial Corp | 3,737 | 0.00 | 251 | 20.10 | ||||
| 2025-08-04 | 13F | Creative Financial Designs Inc /adv | 3,024 | 1,850.97 | 203 | 2,437.50 | ||||
| 2025-08-13 | 13F | SCS Capital Management LLC | 455,434 | 1.94 | 30,614 | 22.39 | ||||
| 2025-04-21 | 13F | S. R. Schill & Associates | 0 | -100.00 | 0 | -100.00 | ||||
| 2025-08-13 | 13F | ASB Consultores, LLC | 35,117 | 0.00 | 2,361 | 20.04 | ||||
| 2025-07-24 | 13F | Us Bancorp \de\ | 1,231 | -1.52 | 83 | 18.84 | ||||
| 2025-07-14 | 13F | Painted Porch Advisors LLC | 115 | 0.00 | 8 | 16.67 | ||||
| 2025-07-24 | 13F | Blair William & Co/il | 2,527 | -9.33 | 170 | 8.33 | ||||
| 2025-08-14 | 13F | HITE Hedge Asset Management LLC | 35,659 | 2,397 | ||||||
| 2025-08-12 | 13F | Park Square Financial Group, LLC | 250 | 0.00 | 17 | 23.08 | ||||
| 2025-07-22 | 13F | Merit Financial Group, LLC | 10,815 | -9.73 | 727 | 8.51 | ||||
| 2025-08-14 | 13F | UBS Group AG | Call | 1,452,800 | 201.47 | 97,657 | 261.95 | |||
| 2025-08-14 | 13F | UBS Group AG | Put | 503,000 | -5.82 | 33,812 | 13.07 | |||
| 2025-08-14 | 13F | CoreCap Advisors, LLC | 380 | -75.64 | 26 | -71.26 | ||||
| 2025-08-14 | 13F | UBS Group AG | 180,166 | -50.51 | 12,111 | -40.58 | ||||
| 2025-05-14 | 13F | HAP Trading, LLC | Put | 0 | -100.00 | 0 | ||||
| 2025-08-13 | 13F | Quadrature Capital Ltd | 0 | -100.00 | 0 | |||||
| 2025-08-14 | 13F | Tudor Investment Corp Et Al | 64,575 | 4,341 | ||||||
| 2025-08-13 | 13F | Walleye Trading LLC | 0 | -100.00 | 0 | -100.00 | ||||
| 2025-08-14 | 13F | Parallax Volatility Advisers, L.P. | Call | 10,000 | -63.64 | 672 | -56.34 | |||
| 2025-08-14 | 13F | Parallax Volatility Advisers, L.P. | 1 | 0.00 | 0 | |||||
| 2025-05-15 | 13F | Crestline Management, LP | 0 | -100.00 | 0 | |||||
| 2025-07-17 | 13F | Sound Income Strategies, LLC | 926 | 1,829.17 | 62 | 3,000.00 | ||||
| 2025-05-15 | 13F | Caption Management, LLC | Call | 0 | -100.00 | 0 | -100.00 | |||
| 2025-07-28 | 13F | Evernest Financial Advisors, LLC | 3,408 | -6.50 | 229 | 12.25 | ||||
| 2025-08-11 | 13F | Nomura Asset Management Co Ltd | 8,000 | -11.11 | 538 | 6.76 | ||||
| 2025-08-14 | 13F | Parallax Volatility Advisers, L.P. | Put | 1,100 | 74 | |||||
| 2025-08-14 | 13F | EP Wealth Advisors, Inc. | 4,571 | -4.19 | 307 | 14.98 | ||||
| 2025-08-13 | 13F | Capula Management Ltd | Put | 0 | -100.00 | 0 | ||||
| 2025-08-14 | 13F | Horizon Investments, LLC | 18 | 0.00 | 1 | 0.00 | ||||
| 2025-08-06 | 13F | Decker Retirement Planning Inc. | 124,256 | 8,353 | ||||||
| 2025-08-14 | 13F | Ausdal Financial Partners, Inc. | 6,581 | -3.91 | 442 | 15.40 | ||||
| 2025-08-14 | 13F | Sunbelt Securities, Inc. | 400 | 0.00 | 23 | 0.00 | ||||
| 2025-07-17 | 13F | Janney Montgomery Scott LLC | 16,558 | -6.16 | 1 | |||||
| 2025-07-07 | 13F | Investors Research Corp | 84 | 0.00 | 6 | 25.00 | ||||
| 2025-08-11 | 13F | Principal Securities, Inc. | 2,325 | 1,023.19 | 156 | 1,318.18 | ||||
| 2025-07-14 | 13F | E&G Advisors, LP | 9,881 | -1.59 | 664 | 18.15 | ||||
| 2025-07-29 | NP | EBI - Longview Advantage ETF | 0 | -100.00 | 0 | -100.00 | ||||
| 2025-08-14 | 13F | Menora Mivtachim Holdings Ltd. | 2,793,050 | 225.51 | 187,749 | 290.80 | ||||
| 2025-08-12 | 13F | Prudential Plc | 135,700 | 340.01 | 9,122 | 428.45 | ||||
| 2025-08-13 | 13F | Walleye Trading LLC | Put | 69,300 | -42.30 | 4,658 | -30.73 | |||
| 2025-08-13 | 13F | Walleye Trading LLC | Call | 49,800 | -28.55 | 3,348 | -14.22 | |||
| 2025-07-16 | 13F | Legend Financial Advisors, Inc. | 123,205 | -1.79 | 8,282 | 17.91 | ||||
| 2025-07-31 | 13F | Orion Capital Management LLC | 78 | 0.00 | 5 | 25.00 | ||||
| 2025-08-11 | 13F | Hexagon Capital Partners LLC | 0 | -100.00 | 0 | |||||
| 2025-08-05 | 13F | Huntington National Bank | 362 | 24 | ||||||
| 2025-04-28 | 13F | ABLE Financial Group, LLC | 0 | -100.00 | 0 | |||||
| 2025-08-01 | NP | APSHX - Pinnacle Sherman Multi-Strategy Core Fund Class A | 4,270 | 287 | ||||||
| 2025-05-15 | 13F | Talon Private Wealth, LLC | 0 | -100.00 | 0 | -100.00 | ||||
| 2025-08-12 | 13F | Deutsche Bank Ag\ | 288 | 0.00 | 19 | 18.75 | ||||
| 2025-07-30 | 13F | Whittier Trust Co Of Nevada Inc | 135 | 0.00 | 9 | 28.57 | ||||
| 2025-08-11 | 13F | Citigroup Inc | 173,992 | -72.43 | 11,696 | -66.90 | ||||
| 2025-05-15 | 13F | Paloma Partners Management Co | Call | 0 | -100.00 | 0 | -100.00 | |||
| 2025-05-15 | 13F | Paloma Partners Management Co | 0 | -100.00 | 0 | -100.00 | ||||
| 2025-08-04 | 13F | Pinnacle Associates Ltd | 22,654 | -0.75 | 1,523 | 19.09 | ||||
| 2025-08-08 | 13F | Family Firm, Inc. | 34,714 | -0.48 | 2,333 | 19.46 | ||||
| 2025-08-13 | 13F | Russell Investments Group, Ltd. | 33 | -29.79 | 2 | 0.00 | ||||
| 2025-04-25 | 13F | K.J. Harrison & Partners Inc | 0 | -100.00 | 0 | -100.00 | ||||
| 2025-05-02 | 13F | Verdence Capital Advisors LLC | 0 | -100.00 | 0 | |||||
| 2025-08-14 | 13F | Quantitative Investment Management, LLC | 0 | -100.00 | 0 | |||||
| 2025-04-16 | 13F | Caldwell Securities, Inc | 0 | -100.00 | 0 | -100.00 | ||||
| 2025-08-12 | 13F | MAI Capital Management | 747 | -49.46 | 50 | -39.02 | ||||
| 2025-08-14 | 13F | Jane Street Group, Llc | 0 | -100.00 | 0 | |||||
| 2025-08-14 | 13F | Fmr Llc | 1,784 | -12.16 | 120 | 5.31 | ||||
| 2025-08-14 | 13F | Maven Securities LTD | 28,156 | 355.52 | 1,893 | 446.82 | ||||
| 2025-08-12 | 13F | CIBC Private Wealth Group, LLC | 0 | -100.00 | 0 | |||||
| 2025-05-15 | 13F | Man Group plc | Put | 0 | -100.00 | 0 | -100.00 | |||
| 2025-05-15 | 13F | Man Group plc | Call | 0 | -100.00 | 0 | -100.00 | |||
| 2025-05-13 | 13F | Quantbot Technologies LP | 0 | -100.00 | 0 | -100.00 | ||||
| 2025-08-13 | 13F | Cresset Asset Management, LLC | 110,521 | 6.69 | 7,429 | 28.09 | ||||
| 2025-05-09 | 13F | GeoWealth Management, LLC | 0 | -100.00 | 0 | |||||
| 2025-08-14 | 13F | Royal Bank Of Canada | 222,304 | 15.13 | 14,944 | 38.23 | ||||
| 2025-08-18 | 13F | N.E.W. Advisory Services LLC | 0 | -100.00 | 0 | |||||
| 2025-07-07 | 13F | Bangor Savings Bank | 100 | 0.00 | 7 | 20.00 | ||||
| 2025-08-07 | 13F | Searle & Co. | 3,620 | 0.00 | 243 | 20.30 | ||||
| 2025-08-07 | 13F | Parkside Financial Bank & Trust | 1,941 | 0.15 | 130 | 20.37 | ||||
| 2025-07-23 | 13F | Wormser Freres Gestion | 2,000 | 0.00 | 134 | 18.58 | ||||
| 2025-05-15 | 13F | Gts Securities Llc | 0 | -100.00 | 0 | |||||
| 2025-07-30 | 13F | Capital Wealth Alliance, LLC | 19,324 | 3.60 | 1,299 | 24.33 | ||||
| 2025-08-06 | 13F | Legacy Wealth Managment, LLC/ID | 250 | 0.00 | 17 | 23.08 | ||||
| 2025-07-10 | 13F | Global Financial Private Client, LLC | 0 | -100.00 | 0 | |||||
| 2025-07-09 | 13F | Lake Hills Wealth Management, LLC | 0 | -100.00 | 0 | |||||
| 2025-08-15 | 13F | CI Private Wealth, LLC | 36,844 | 19.67 | 2,477 | 43.70 | ||||
| 2025-05-15 | 13F | Twin Tree Management, LP | 0 | -100.00 | 0 | -100.00 | ||||
| 2025-07-29 | 13F | Private Trust Co Na | 400 | 0.00 | 27 | 18.18 | ||||
| 2025-08-14 | 13F | Wells Fargo & Company/mn | 224,681 | 19.10 | 15,103 | 42.99 | ||||
| 2025-07-23 | 13F | Magnolia Capital Management Ltd | 4,065 | 0.00 | 0 | |||||
| 2025-08-01 | 13F | Chilton Capital Management Llc | 200 | 13 | ||||||
| 2025-08-13 | 13F | Capula Management Ltd | Call | 0 | -100.00 | 0 | ||||
| 2025-08-14 | 13F | Tudor Investment Corp Et Al | Call | 0 | -100.00 | 0 | -100.00 | |||
| 2025-08-06 | 13F | AE Wealth Management LLC | 111,294 | 5,604.46 | 7,481 | 6,763.30 | ||||
| 2025-08-14 | 13F | Wells Fargo & Company/mn | Call | 377,600 | -14.42 | 25,382 | 2.75 | |||
| 2025-08-06 | 13F | Walkner Condon Financial Advisors LLC | 3,578 | 0.00 | 241 | 20.00 | ||||
| 2025-08-14 | 13F | Man Group plc | 10,108 | 679 | ||||||
| 2025-08-05 | 13F | Harel Insurance Investments & Financial Services Ltd. | 935,500 | 0.00 | 63 | 19.23 | ||||
| 2025-08-01 | 13F | Oversea-Chinese Banking CORP Ltd | 0 | -100.00 | 0 | |||||
| 2025-08-04 | 13F | Canton Hathaway, LLC | 2,376 | -17.39 | 0 | |||||
| 2025-08-26 | 13F | Claris Financial LLC | 0 | -100.00 | 0 | |||||
| 2025-08-06 | 13F | Texas Yale Capital Corp. | 7,454 | 14.17 | 501 | 37.26 | ||||
| 2025-05-05 | 13F | Nwam Llc | 0 | -100.00 | 0 | |||||
| 2025-08-14 | 13F | Mml Investors Services, Llc | 8,428 | 6.08 | 1 | |||||
| 2025-08-29 | 13F | Centaurus Financial, Inc. | 1,575 | 0 | ||||||
| 2025-08-12 | 13F | LPL Financial LLC | 468,275 | 2.31 | 31,477 | 22.83 | ||||
| 2025-04-23 | 13F | Security National Bank | 0 | -100.00 | 0 | |||||
| 2025-08-14 | 13F | Barometer Capital Management Inc. | 5,100 | 343 | ||||||
| 2025-04-28 | 13F | Strategic Financial Concepts, LLC | 0 | -100.00 | 0 | -100.00 | ||||
| 2025-07-08 | 13F/A | Salem Investment Counselors Inc | 36 | 0.00 | 2 | 0.00 | ||||
| 2025-08-14 | 13F | Headlands Technologies LLC | 165 | -24.31 | 11 | -8.33 |