Statistik Asas
| Pemilik Institusi | 209 total, 209 long only, 0 short only, 0 long/short - change of -5.83% MRQ |
| Purata Peruntukan Portfolio | 0.1348 % - change of -0.98% MRQ |
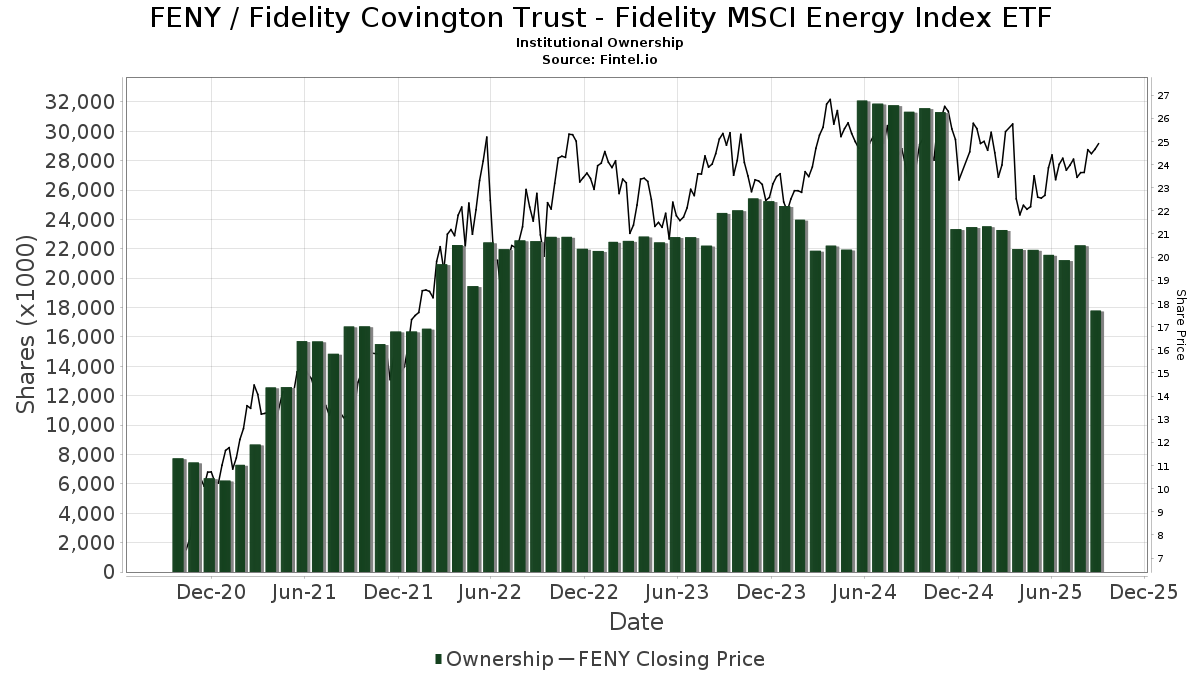
| Saham Institusi (Panjang) | 17,793,301 (ex 13D/G) - change of -3.79MM shares -17.57% MRQ |
| Nilai Institusi (Panjang) | $ 365,066 USD ($1000) |
Pemilikan Institusi dan Pemegang Saham
Fidelity Covington Trust - Fidelity MSCI Energy Index ETF (US:FENY) telah 209 pemilik institusi dan pemegang saham yang telah memfailkan borang 13D/G atau 13F dengan Suruhanjaya Bursa Sekuriti (SEC). Institusi ini memegang sejumlah 17,793,301 saham. Pemegang saham terbesar termasuk Lido Advisors, LLC, Commonwealth Equity Services, Llc, Envestnet Asset Management Inc, Agf Management Ltd, LPL Financial LLC, HighTower Advisors, LLC, Yarbrough Capital, LLC, Northwestern Mutual Wealth Management Co, Bnp Paribas Arbitrage, Sa, and Soundwatch Capital LLC .
Fidelity Covington Trust - Fidelity MSCI Energy Index ETF (ARCA:FENY) struktur pemilikan institusi menunjukkan kedudukan semasa dalam syarikat mengikut institusi dan dana serta perubahan terkini dalam saiz kedudukan. Pemegang saham utama boleh termasuk pelabur individu, dana amanah, dana lindung nilai atau institusi. Jadual 13D menunjukkan bahawa pelabur memegang (atau menahan) lebih daripada 5% syarikat dan berhasrat (atau berniat) untuk secara aktif meneruskan perubahan dalam strategi perniagaan. Jadual 13G menunjukkan pelaburan pasif melebihi 5%.
The share price as of September 5, 2025 is 24.19 / share. Previously, on September 6, 2024, the share price was 23.54 / share. This represents an increase of 2.76% over that period.
Skor Sentimen Dana
Skor Sentimen Dana (Skor Pengumpulan Pemilikan fka) mencari saham yang paling banyak dibeli oleh dana. Ia adalah hasil daripada model kuantitatif pelbagai faktor yang canggih yang mengenal pasti syarikat dengan tahap pengumpulan institusi tertinggi. Model pemarkahan ini menggunakan gabungan jumlah kenaikan dalam pemilik yang didedahkan, perubahan dalam peruntukan portfolio dalam pemilik tersebut dan metrik lain. Nombornya berjulat dari 0 hingga 100, dengan nombor yang lebih tinggi menunjukkan tahap pengumpulan yang lebih tinggi kepada rakannya, dan 50 adalah nombor purata.
Kekerapan Kemas Kini: Harian
Lihat Peneroka Pemilikan yang menyediakan senarai syarikat yang mempunyai kedudukan tertinggi.
Nisbah Put/Call Institusi
Selain melaporkan isu ekuiti dan hutang standard, institusi yang mempunyai lebih daripada 100MM aset di bawah pengurusan juga mesti mendedahkan pegangan opsyen jual dan beli mereka. Memandangkan opsyen jual secara amnya menunjukkan sentimen negatif, dan opsyen beli menunjukkan sentimen positif, kita boleh mendapatkan gambaran keseluruhan sentimen institusi dengan merencanakan nisbah jual kepada beli. Carta di sebelah kanan memplotkan nisbah jual/beli sejarah untuk instrumen ini.
Menggunakan Nisbah Put/Callsebagai penunjuk sentimen pelabur mengatasi salah satu kekurangan utama menggunakan jumlah pemilikan institusi, iaitu sejumlah besar aset di bawah pengurusan dilaburkan secara pasif untuk menjejaki indeks. Dana yang diurus secara pasif biasanya tidak membeli opsyen, jadi penunjuk nisbah put/call mengekori rapat sentimen dana yang diurus secara aktif.

Pemfailan 13F dan NPORT
Butiran mengenai pemfailan 13F adalah percuma. Perincian mengenai pemfailan NP memerlukan keahlian premium. Baris hijau menunjukkan kedudukan baharu. Baris merah menunjukkan kedudukan tertutup. Klik pautan ikon untuk melihat sejarah transaksi penuh.
Naik Taraf
untuk membuka data premium dan mengeksport ke Excel ![]() .
.
| Tarikh Fail | Sumber | Pelabur | Jenis | Purata Harga (Ang) |
Saham | ΔSaham (%) |
Nilai Dilaporkan ($1000) |
Δ Nilai (%) |
Peruntukan Port (%) |
|
|---|---|---|---|---|---|---|---|---|---|---|
| 2025-07-21 | 13F | Ameritas Advisory Services, LLC | 21,178 | -31.88 | 497 | -36.33 | ||||
| 2025-08-14 | 13F | Full Sail Capital, LLC | 48,673 | 24.61 | 1,141 | 14.44 | ||||
| 2025-07-14 | 13F | Sweeney & Michel, Llc | 14,839 | -6.13 | 365 | 10.94 | ||||
| 2025-08-14 | 13F | Mercer Global Advisors Inc /adv | 0 | -100.00 | 0 | |||||
| 2025-08-05 | 13F | Mountain Hill Investment Partners Corp. | 492 | 0.82 | 12 | -8.33 | ||||
| 2025-08-14 | 13F | Cubist Systematic Strategies, LLC | 0 | -100.00 | 0 | |||||
| 2025-08-08 | 13F | Capital Investment Advisory Services, LLC | 50 | 0.00 | 1 | 0.00 | ||||
| 2025-08-14 | 13F | Visionary Wealth Advisors | 0 | -100.00 | 0 | |||||
| 2025-08-12 | 13F | Jacobi Capital Management LLC | 108,231 | 0.74 | 2,538 | -7.51 | ||||
| 2025-08-14 | 13F | Snowden Capital Advisors LLC | 26,151 | -13.41 | 613 | -20.49 | ||||
| 2025-07-14 | 13F | Park Avenue Securities Llc | 102,600 | 2 | ||||||
| 2025-08-04 | 13F | Creative Financial Designs Inc /adv | 4,838 | 0.06 | 113 | -8.13 | ||||
| 2025-08-06 | 13F | Able Wealth Management LLC | 0 | -100.00 | 0 | |||||
| 2025-08-14 | 13F | Bnp Paribas Arbitrage, Sa | 600,000 | 111,011.11 | 14,070 | 108,130.77 | ||||
| 2025-08-14 | 13F | Stifel Financial Corp | 105,054 | -2.92 | 2,464 | -10.89 | ||||
| 2025-08-14 | 13F | Fmr Llc | 74,017 | -98.68 | 1,736 | -98.79 | ||||
| 2025-08-08 | 13F | IMA Wealth, Inc. | 1,501 | 0.00 | 35 | -7.89 | ||||
| 2025-04-23 | 13F | Mascagni Wealth Management, Inc. | 0 | -100.00 | 0 | -100.00 | ||||
| 2025-05-15 | 13F | Centric Wealth Management | 0 | -100.00 | 0 | -100.00 | ||||
| 2025-08-01 | 13F | Envestnet Asset Management Inc | 1,222,648 | 427.53 | 28,671 | 384.23 | ||||
| 2025-08-13 | 13F | Flow Traders U.s. Llc | 0 | -100.00 | 0 | |||||
| 2025-08-13 | 13F | Renaissance Technologies Llc | 0 | -100.00 | 0 | |||||
| 2025-07-15 | 13F | Fifth Third Bancorp | 1,821 | 0.00 | 43 | -8.70 | ||||
| 2025-07-31 | 13F/A | Avion Wealth | 798 | 0.00 | 0 | |||||
| 2025-08-14 | 13F | Susquehanna International Group, Llp | Call | 33,800 | 53.64 | 793 | 40.93 | |||
| 2025-08-14 | 13F | Susquehanna International Group, Llp | 14,152 | -74.12 | 332 | -76.31 | ||||
| 2025-08-01 | 13F | Y-Intercept (Hong Kong) Ltd | 0 | -100.00 | 0 | |||||
| 2025-08-15 | 13F | Captrust Financial Advisors | 8,634 | 202 | ||||||
| 2025-04-29 | 13F | Element Wealth, LLC | 0 | -100.00 | 0 | |||||
| 2025-08-12 | 13F | Atlas Capital Advisors Llc | 11,566 | -52.94 | 271 | -56.85 | ||||
| 2025-07-17 | 13F | Wolff Wiese Magana Llc | 77 | 0.00 | 2 | 0.00 | ||||
| 2025-05-09 | 13F | Delta Financial Group, Inc. | 8,325 | 0 | ||||||
| 2025-07-18 | 13F | Founders Capital Management | 593 | 0.00 | 14 | -13.33 | ||||
| 2025-08-07 | 13F | Allworth Financial LP | 1,244 | 0.00 | 29 | 3.57 | ||||
| 2025-07-16 | 13F | Fischer Financial Services, Inc. | 11,911 | -8.26 | 279 | -15.71 | ||||
| 2025-04-21 | 13F | Nelson, Van Denburg & Campbell Wealth Management Group, LLC | 0 | -100.00 | 0 | |||||
| 2025-07-08 | 13F | Heartwood Wealth Advisors LLC | 9,409 | 0.00 | 221 | -8.33 | ||||
| 2025-08-12 | 13F | Pathstone Holdings, LLC | 0 | -100.00 | 0 | |||||
| 2025-07-31 | 13F | Brighton Jones Llc | 9,158 | 215 | ||||||
| 2025-08-12 | 13F | Proequities, Inc. | 0 | 0 | ||||||
| 2025-07-16 | 13F | Brown, Lisle/cummings, Inc. | 65 | 0.00 | 2 | 0.00 | ||||
| 2025-07-23 | 13F | Pillar Financial Advisors, LLC | 50 | 0.00 | 1 | 0.00 | ||||
| 2025-08-06 | 13F | Columbia River Financial Group, LLC | 0 | -100.00 | 0 | |||||
| 2025-08-12 | 13F | Strategic Advisors LLC | 19,832 | -1.30 | 465 | -9.36 | ||||
| 2025-07-29 | 13F | Stratos Wealth Advisors, LLC | 49,468 | -5.91 | 1,160 | -13.63 | ||||
| 2025-08-14 | 13F | Sunbelt Securities, Inc. | 107,370 | 36.91 | 2,560 | 27.76 | ||||
| 2025-08-05 | 13F | GPS Wealth Strategies Group, LLC | 0 | -100.00 | 0 | |||||
| 2025-07-17 | 13F/A | Capital Investment Advisors, LLC | 26,898 | -4.90 | 631 | -12.74 | ||||
| 2025-05-15 | 13F/A | Orion Portfolio Solutions, LLC | 8,144 | 208 | ||||||
| 2025-07-24 | 13F | Galvin, Gaustad & Stein, LLC | 17,033 | -3.52 | 399 | -11.53 | ||||
| 2025-05-14 | 13F | Evergreen Wealth Solutions, LLC | 0 | -100.00 | 0 | |||||
| 2025-07-17 | 13F | CWA Asset Management Group, LLC | 16,452 | 386 | ||||||
| 2025-08-08 | 13F | Pnc Financial Services Group, Inc. | 1,639 | 26.08 | 38 | 15.15 | ||||
| 2025-05-16 | 13F/A | Kestra Investment Management, LLC | 0 | -100.00 | 0 | |||||
| 2025-08-13 | 13F | Financial Freedom, LLC | 27,958 | 0.90 | 656 | -7.36 | ||||
| 2025-08-14 | 13F | Citadel Advisors Llc | Call | 0 | -100.00 | 0 | ||||
| 2025-08-06 | 13F | Aspetuck Financial Management LLC | 69,486 | -0.54 | 1,629 | -8.69 | ||||
| 2025-04-10 | 13F | Sugar Maple Asset Management, LLC | 0 | -100.00 | 0 | |||||
| 2025-08-15 | 13F | Kestra Advisory Services, LLC | 267,576 | 21.38 | 6,275 | 11.40 | ||||
| 2025-07-30 | 13F | Financial Perspectives, Inc | 57,116 | 4.21 | 1,339 | -4.36 | ||||
| 2025-08-14 | 13F | GWM Advisors LLC | 157,595 | 3.55 | 3,696 | -4.96 | ||||
| 2025-07-31 | 13F | CAP Partners, LLC | 15,982 | -3.34 | 375 | -11.37 | ||||
| 2025-08-08 | 13F | Foundations Investment Advisors, LLC | 10,281 | 241 | ||||||
| 2025-07-22 | 13F | Yoder Wealth Management, Inc. | 107,851 | 2.76 | 2,529 | -5.67 | ||||
| 2025-08-12 | 13F | Steward Partners Investment Advisory, Llc | 109,025 | 571.58 | 2,557 | 517.39 | ||||
| 2025-04-16 | 13F/A | Western Wealth Management, LLC | 0 | -100.00 | 0 | |||||
| 2025-07-30 | 13F | Brookstone Capital Management | 8,707 | -24.54 | 204 | -30.61 | ||||
| 2025-08-12 | 13F | Jpmorgan Chase & Co | 73,598 | 16.37 | 1,726 | 6.81 | ||||
| 2025-07-16 | 13F/A | CX Institutional | 39 | -97.91 | 0 | |||||
| 2025-07-16 | 13F | Signature Resources Capital Management, LLC | 525 | 12 | ||||||
| 2025-07-29 | 13F | Stratos Wealth Partners, LTD. | 12,000 | -3.54 | 281 | -11.36 | ||||
| 2025-08-13 | 13F | KDK Private Wealth Management, LLC | 25,237 | -2.67 | 592 | -10.73 | ||||
| 2025-07-30 | 13F | Exencial Wealth Advisors, Llc | 11,765 | 0.00 | 276 | -8.33 | ||||
| 2025-04-15 | 13F | Focus Financial Network, Inc. | 0 | -100.00 | 0 | |||||
| 2025-07-30 | 13F | Gables Capital Management Inc. | 701 | 0.00 | 16 | -5.88 | ||||
| 2025-07-25 | 13F | Hazlett, Burt & Watson, Inc. | 300 | 0.00 | 0 | |||||
| 2025-08-14 | 13F | Harwood Advisory Group, LLC | 0 | -100.00 | 0 | -100.00 | ||||
| 2025-08-06 | 13F | Agf Management Ltd | 897,920 | 6.81 | 21,056 | -1.97 | ||||
| 2025-07-23 | 13F | Clear Creek Financial Management, LLC | 0 | -100.00 | 0 | |||||
| 2025-05-16 | 13F | Prostatis Group LLC | 0 | -100.00 | 0 | |||||
| 2025-08-11 | 13F | Brown Brothers Harriman & Co | 500 | 0.00 | 12 | -8.33 | ||||
| 2025-04-17 | 13F | Grimes & Company, Inc. | 0 | -100.00 | 0 | |||||
| 2025-08-08 | 13F | Cetera Investment Advisers | 425,794 | 406.73 | 9,985 | 365.24 | ||||
| 2025-08-14 | 13F | Bank of Marin | 26,653 | -3.03 | 625 | -10.97 | ||||
| 2025-08-04 | 13F | Bay Colony Advisory Group, Inc d/b/a Bay Colony Advisors | 14,659 | 0.00 | 344 | -7.30 | ||||
| 2025-08-12 | 13F | Accredited Wealth Management, LLC | 3,341 | 14.03 | 78 | 5.41 | ||||
| 2025-08-14 | 13F | Glenmede Investment Management, LP | 353 | 8 | ||||||
| 2025-08-14 | 13F | Fiduciary Trust Co | 12,010 | 0.00 | 282 | -8.17 | ||||
| 2025-08-08 | 13F | Meridian Wealth Management, LLC | 10,993 | -0.47 | 258 | -8.87 | ||||
| 2025-07-14 | 13F | Toth Financial Advisory Corp | 0 | -100.00 | 0 | |||||
| 2025-08-13 | 13F | Jones Financial Companies Lllp | 17,269 | 49.87 | 407 | 39.86 | ||||
| 2025-08-12 | 13F | O'shaughnessy Asset Management, Llc | 5,579 | 310.82 | 131 | 282.35 | ||||
| 2025-07-31 | 13F | Cambridge Investment Research Advisors, Inc. | 126,908 | -4.80 | 3 | -33.33 | ||||
| 2025-05-09 | 13F | Charles Schwab Investment Management Inc | 0 | -100.00 | 0 | |||||
| 2025-05-16 | 13F | Coppell Advisory Solutions LLC | 0 | -100.00 | 0 | |||||
| 2025-08-12 | 13F | Bravias Capital Group, LLC | 32,037 | 9.49 | 751 | 0.54 | ||||
| 2025-08-05 | 13F | Sigma Planning Corp | 19,086 | -2.84 | 448 | -10.78 | ||||
| 2025-07-29 | 13F | Salomon & Ludwin, LLC | 386 | 0.00 | 9 | 0.00 | ||||
| 2025-04-25 | 13F | New Wave Wealth Advisors Llc | 0 | -100.00 | 0 | |||||
| 2025-07-08 | 13F | Parallel Advisors, LLC | 0 | -100.00 | 0 | |||||
| 2025-08-04 | 13F | Creekmur Asset Management LLC | 1,223 | 0.91 | 29 | -6.67 | ||||
| 2025-08-04 | 13F | Spire Wealth Management | 296 | -74.50 | 7 | -79.31 | ||||
| 2025-07-28 | 13F | Kiker Wealth Management, LLC | 2,008 | 66,833.33 | 47 | |||||
| 2025-07-08 | 13F | Nbc Securities, Inc. | 2,972 | -42.77 | 0 | |||||
| 2025-08-01 | 13F | Vision Financial Markets Llc | 102 | 0.99 | 2 | 0.00 | ||||
| 2025-08-14 | 13F | UBS Group AG | 74,981 | -75.21 | 1,758 | -77.25 | ||||
| 2025-08-13 | 13F | EverSource Wealth Advisors, LLC | 379 | 0.80 | 9 | -11.11 | ||||
| 2025-08-12 | 13F | Inscription Capital, LLC | 0 | -100.00 | 0 | |||||
| 2025-07-21 | 13F | Pflug Koory, LLC | 490 | 0.00 | 11 | -8.33 | ||||
| 2025-08-14 | 13F | Two Sigma Securities, Llc | 0 | -100.00 | 0 | |||||
| 2025-07-21 | 13F | Patriot Financial Group Insurance Agency, LLC | 64,860 | 2.34 | 1,521 | -6.11 | ||||
| 2025-07-29 | 13F | Activest Wealth Management | 39 | 2.63 | 1 | |||||
| 2025-07-10 | 13F | Charter Oak Capital Management, LLC | 13,966 | -5.04 | 327 | -12.80 | ||||
| 2025-07-28 | 13F | Harbour Investments, Inc. | 12,998 | -28.11 | 305 | -34.06 | ||||
| 2025-08-14 | 13F | Kovitz Investment Group Partners, LLC | 40,425 | -21.94 | 948 | -28.42 | ||||
| 2025-08-12 | 13F | CIBC Private Wealth Group, LLC | 89 | 1.14 | 2 | 100.00 | ||||
| 2025-08-14 | 13F | Toroso Investments, LLC | 54,669 | 1,282 | ||||||
| 2025-08-19 | 13F | Advisory Services Network, LLC | 52,495 | -77.07 | 1,265 | -78.39 | ||||
| 2025-08-13 | 13F | Natixis Advisors, L.p. | 33,543 | 0.10 | 1 | |||||
| 2025-08-14 | 13F | Citadel Advisors Llc | 66,343 | -21.01 | 1,556 | -27.51 | ||||
| 2025-08-14 | 13F | Tudor Investment Corp Et Al | 255,728 | 5,997 | ||||||
| 2025-08-14 | 13F | Wells Fargo & Company/mn | 465,306 | -9.70 | 10,911 | -17.12 | ||||
| 2025-08-14 | 13F | Citadel Advisors Llc | Put | 0 | -100.00 | 0 | ||||
| 2025-08-12 | 13F | Guerra Advisors Inc | 252,077 | 58.95 | 5,911 | 45.91 | ||||
| 2025-08-14 | 13F | Raymond James Financial Inc | 46,257 | -6.11 | 1,085 | -13.83 | ||||
| 2025-08-13 | 13F | Cutler Capital Management, LLC | 270,509 | 2.66 | 6,343 | -5.78 | ||||
| 2025-04-23 | 13F | VisionPoint Advisory Group, LLC | 0 | -100.00 | 0 | |||||
| 2025-05-21 | 13F/A | Geneos Wealth Management Inc. | 65 | 2 | ||||||
| 2025-07-24 | 13F | IFP Advisors, Inc | 2,822 | -37.47 | 66 | -42.61 | ||||
| 2025-07-25 | 13F | Cwm, Llc | 23,399 | -1.93 | 1 | |||||
| 2025-07-30 | 13F | D.a. Davidson & Co. | 40,600 | -9.36 | 952 | -16.78 | ||||
| 2025-07-28 | 13F | Rosenberg Matthew Hamilton | 11,394 | 0.00 | 267 | -8.25 | ||||
| 2025-08-11 | 13F | Core Wealth Partners LLC | 18,547 | 0.00 | 435 | -8.25 | ||||
| 2025-07-25 | 13F | Atria Wealth Solutions, Inc. | 36,596 | -16.08 | 880 | -21.10 | ||||
| 2025-08-05 | 13F | Lifeworks Advisors, LLC | 15,856 | 18.88 | 372 | 9.12 | ||||
| 2025-06-30 | NP | Northern Lights Fund Trust - PFG Fidelity Institutional AM® Equity Sector Strategy Fund Class R Shares | 186,797 | -65.67 | 4,123 | -68.86 | ||||
| 2025-08-12 | 13F | Global Retirement Partners, LLC | 1,475 | 3.44 | 35 | 0.00 | ||||
| 2025-05-01 | 13F | High Note Wealth, LLC | 0 | -100.00 | 0 | |||||
| 2025-09-04 | 13F/A | Advisor Group Holdings, Inc. | 207,210 | -37.21 | 4,865 | -42.35 | ||||
| 2025-08-12 | 13F | Archer Investment Corp | 952 | 0.32 | 22 | -8.33 | ||||
| 2025-07-18 | 13F | Truist Financial Corp | 28,991 | -3.29 | 681 | -11.11 | ||||
| 2025-07-24 | 13F | Stonebridge Financial Group, LLC | 0 | -100.00 | 0 | |||||
| 2025-08-07 | 13F | Kestra Private Wealth Services, Llc | 0 | -100.00 | 0 | |||||
| 2025-05-14 | 13F | Capital Analysts, Inc. | 0 | -100.00 | 0 | |||||
| 2025-08-05 | 13F | Mission Wealth Management, Lp | 9,703 | 0.71 | 228 | -7.72 | ||||
| 2025-07-24 | 13F | Court Place Advisors, LLC | 11,149 | -4.46 | 261 | -12.42 | ||||
| 2025-08-14 | 13F | Certified Advisory Corp | 0 | -100.00 | 0 | |||||
| 2025-08-14 | 13F | Wilkins Miller Wealth Management, LLC | 11,811 | 0.93 | 277 | -7.69 | ||||
| 2025-07-18 | 13F | Parsons Capital Management Inc/ri | 40,774 | 0.24 | 956 | -7.99 | ||||
| 2025-08-11 | 13F | Aptus Capital Advisors, LLC | 410 | -42.25 | 10 | -50.00 | ||||
| 2025-08-12 | 13F | Soundwatch Capital LLC | 482,182 | 476 | ||||||
| 2025-07-15 | 13F | Lynch & Associates/in | 54,505 | 2.36 | 1,278 | -6.03 | ||||
| 2025-07-11 | 13F | Farther Finance Advisors, LLC | 6,831 | 21,935.48 | 160 | |||||
| 2025-08-05 | 13F | Bank of New York Mellon Corp | 135,347 | 3,174 | ||||||
| 2025-07-11 | 13F | AA Financial Advisors, LLC | 19,118 | 4.25 | 448 | -4.27 | ||||
| 2025-07-07 | 13F | Nova Wealth Management, Inc. | 32 | -98.61 | 1 | -100.00 | ||||
| 2025-08-01 | 13F | Gwn Securities Inc. | 0 | -100.00 | 0 | |||||
| 2025-08-15 | 13F | Equitable Holdings, Inc. | 9,049 | -3.80 | 212 | -11.67 | ||||
| 2025-08-08 | 13F | Avantax Advisory Services, Inc. | 150,940 | 201.43 | 3,540 | 176.70 | ||||
| 2025-08-14 | 13F | Mml Investors Services, Llc | 8,987 | -2.92 | 0 | |||||
| 2025-08-14 | 13F | Hrt Financial Lp | 0 | -100.00 | 0 | |||||
| 2025-07-23 | 13F | Heck Capital Advisors, LLC | 56,482 | 145.94 | 1,324 | 125.94 | ||||
| 2025-08-14 | 13F | Brinker Capital Investments, LLC | 0 | -100.00 | 0 | |||||
| 2025-08-08 | 13F | Hartland & Co., LLC | 5,715 | 0.00 | 134 | -8.22 | ||||
| 2025-04-28 | 13F | Strategic Financial Concepts, LLC | 0 | -100.00 | 0 | -100.00 | ||||
| 2025-07-31 | 13F | Sage Mountain Advisors LLC | 1,200 | 0.00 | 28 | -6.67 | ||||
| 2025-07-09 | 13F | Bank of New Hampshire | 279 | 0.00 | 7 | -14.29 | ||||
| 2025-08-14 | 13F | Qube Research & Technologies Ltd | 5,219 | 4,601.80 | 122 | 6,000.00 | ||||
| 2025-05-30 | NP | ERNZ - TrueShares Active Yield ETF | 5,930 | 152 | ||||||
| 2025-08-05 | 13F | EPG Wealth Management LLC | 45,532 | -2.77 | 1,068 | -10.79 | ||||
| 2025-07-24 | 13F | Eastern Bank | 0 | -100.00 | 0 | |||||
| 2025-08-12 | 13F | MAI Capital Management | 5,397 | 0.00 | 127 | -8.03 | ||||
| 2025-04-24 | 13F | Decker Retirement Planning Inc. | 0 | -100.00 | 0 | |||||
| 2025-08-14 | 13F | Bank Of America Corp /de/ | 205,460 | 3.71 | 4,818 | -4.80 | ||||
| 2025-08-11 | 13F | HighTower Advisors, LLC | 745,905 | -27.02 | 17,491 | -33.02 | ||||
| 2025-07-10 | 13F | Wealth Enhancement Advisory Services, Llc | 23,137 | 17.37 | 556 | 10.54 | ||||
| 2025-04-23 | 13F | PMV Capital Advisers, LLC | 0 | -100.00 | 0 | |||||
| 2025-08-12 | 13F | Franklin Resources Inc | 0 | -100.00 | 0 | |||||
| 2025-08-11 | 13F | Private Advisor Group, LLC | 219,528 | 1.82 | 5,148 | -6.55 | ||||
| 2025-07-22 | 13F | Miracle Mile Advisors, LLC | 140,714 | 10.60 | 3,300 | 1.51 | ||||
| 2025-08-27 | NP | Tidal Trust II - Tactical Advantage ETF | 54,669 | 1,282 | ||||||
| 2025-07-30 | 13F | Eqis Capital Management, Inc. | 58,568 | -8.71 | 1,373 | -16.23 | ||||
| 2025-08-05 | 13F | Trail Ridge Investment Advisors, LLC | 104,491 | -5.62 | 2,517 | -11.00 | ||||
| 2025-07-15 | 13F | Yarbrough Capital, LLC | 711,695 | 0.00 | 16,689 | -8.22 | ||||
| 2025-07-23 | 13F | Elm3 Financial Group, LLC | 0 | -100.00 | 0 | |||||
| 2025-07-28 | 13F | RFG Advisory, LLC | 0 | -100.00 | 0 | |||||
| 2025-08-07 | 13F | BOK Financial Private Wealth, Inc. | 191 | 0.00 | 4 | 0.00 | ||||
| 2025-08-06 | 13F | AE Wealth Management LLC | 107,820 | 12.06 | 2,528 | 2.85 | ||||
| 2025-08-08 | 13F | Creative Planning | 30,700 | 0.91 | 720 | -7.46 | ||||
| 2025-07-15 | 13F | Financial Partners Group, Inc | 165,951 | -22.86 | 3,892 | -29.20 | ||||
| 2025-08-07 | 13F | Traynor Capital Management, Inc. | 160,093 | -12.36 | 3,775 | -19.12 | ||||
| 2025-07-15 | 13F | BCS Wealth Management | 8,603 | 0 | ||||||
| 2025-08-13 | 13F | Summit Financial, LLC | 12,698 | -4.87 | 298 | -12.90 | ||||
| 2025-08-04 | 13F | Arkadios Wealth Advisors | 49,448 | 5.59 | 1,160 | -3.09 | ||||
| 2025-07-11 | 13F | LongView Wealth Management | 8,771 | 206 | ||||||
| 2025-07-14 | 13F | U.S. Capital Wealth Advisors, LLC | 27,223 | -7.63 | 638 | -15.27 | ||||
| 2025-07-15 | 13F | Cranbrook Wealth Management, LLC | 0 | -100.00 | 0 | |||||
| 2025-04-21 | 13F | Envestnet Portfolio Solutions, Inc. | 0 | -100.00 | 0 | |||||
| 2025-08-18 | 13F/A | National Bank Of Canada /fi/ | 692 | 83.07 | 16 | 77.78 | ||||
| 2025-07-16 | 13F | American National Bank | 27,115 | 2.62 | 636 | -5.93 | ||||
| 2025-07-07 | 13F | Roxbury Financial LLC | 24,607 | -24.43 | 577 | -28.85 | ||||
| 2025-07-03 | 13F | TrueWealth Advisors, LLC | 12,527 | -1.46 | 294 | -9.57 | ||||
| 2025-08-12 | 13F | Nemes Rush Group LLC | 0 | -100.00 | 0 | |||||
| 2025-07-29 | 13F | Primoris Wealth Advisors, Llc | 10,500 | 246 | ||||||
| 2025-08-14 | 13F | Investmark Advisory Group LLC | 9,435 | -1.02 | 221 | -9.05 | ||||
| 2025-08-06 | 13F | Atlantic Union Bankshares Corp | 100 | 2 | ||||||
| 2025-08-13 | 13F | Northwestern Mutual Wealth Management Co | 620,754 | -15.57 | 14,557 | -22.51 | ||||
| 2025-08-05 | 13F | Bank Of Montreal /can/ | 70 | 0.00 | 2 | 0.00 | ||||
| 2025-08-06 | 13F | Kcm Investment Advisors Llc | 173,293 | -3.50 | 4,064 | -11.44 | ||||
| 2025-05-09 | 13F | Pathway Financial Advisers, LLC | 0 | -100.00 | 0 | |||||
| 2025-07-21 | 13F | HighMark Wealth Management LLC | 500 | 0.00 | 12 | -8.33 | ||||
| 2025-08-14 | 13F | Comerica Bank | 1,603 | -59.50 | 38 | -63.37 | ||||
| 2025-07-24 | 13F | Bernard Wealth Management Corp. | 1,263 | 0.00 | 30 | -9.37 | ||||
| 2025-08-07 | 13F | Addison Advisors LLC | 353 | 0.00 | 8 | -11.11 | ||||
| 2025-07-31 | 13F | LJI Wealth Management, LLC | 13,770 | -5.03 | 323 | -12.97 | ||||
| 2025-08-12 | 13F | SRS Capital Advisors, Inc. | 775 | 18 | ||||||
| 2025-07-15 | 13F | Sheets Smith Wealth Management | 40,994 | 0.00 | 961 | -8.21 | ||||
| 2025-04-30 | 13F | Brown Advisory Inc | 0 | -100.00 | 0 | |||||
| 2025-08-08 | 13F | Wealth Quarterback LLC | 80,779 | -10.12 | 1,894 | -17.51 | ||||
| 2025-08-08 | 13F | Larson Financial Group LLC | 2,105 | 0.29 | 49 | -7.55 | ||||
| 2025-08-14 | 13F | Mariner, LLC | 79,560 | -22.35 | 1,866 | -28.74 | ||||
| 2025-07-25 | 13F | LRI Investments, LLC | 4,536 | 0.00 | 106 | -7.83 | ||||
| 2025-08-13 | 13F | Russell Investments Group, Ltd. | 0 | -100.00 | 0 | |||||
| 2025-07-18 | 13F | Vicus Capital | 31,056 | 0.67 | 728 | -7.61 | ||||
| 2025-07-17 | 13F | Smith, Salley & Associates | 48,442 | 0.55 | 1,136 | -7.72 | ||||
| 2025-08-13 | 13F | Lido Advisors, LLC | 1,561,825 | 4.30 | 36,625 | -4.27 | ||||
| 2025-07-23 | 13F | Traphagen Investment Advisors Llc | 8,933 | 0.44 | 209 | -7.93 | ||||
| 2025-08-07 | 13F | Hughes Financial Services, LLC | 42 | 0.00 | 1 | -100.00 | ||||
| 2025-08-19 | 13F | Asset Dedication, LLC | 208 | 0.00 | 5 | -20.00 | ||||
| 2025-08-14 | 13F | EP Wealth Advisors, Inc. | 29,610 | 0.18 | 694 | -8.08 | ||||
| 2025-05-12 | 13F | Sandy Spring Bank | 100 | 0.00 | 3 | 0.00 | ||||
| 2025-05-06 | 13F | Venturi Wealth Management, LLC | 0 | -100.00 | 0 | -100.00 | ||||
| 2025-05-15 | 13F | National Wealth Management Group, LLC | 8,167 | 209 | ||||||
| 2025-08-14 | 13F | Goldman Sachs Group Inc | 11,839 | 278 | ||||||
| 2025-08-04 | 13F | Prairie Wealth Advisors, Inc. | 26,685 | -1.02 | 626 | -9.16 | ||||
| 2025-08-13 | 13F | Quadrature Capital Ltd | 267,554 | 392.17 | 6,274 | 352.34 | ||||
| 2025-08-13 | 13F | Congress Wealth Management LLC / DE / | 40,047 | 22.43 | 939 | 12.59 | ||||
| 2025-07-14 | 13F | UMA Financial Services, Inc. | 606 | -18.00 | 14 | -22.22 | ||||
| 2025-07-14 | 13F | CRA Financial Services, LLC | 9,450 | -1.31 | 222 | -9.43 | ||||
| 2025-08-01 | 13F | Chilton Capital Management Llc | 0 | -100.00 | 0 | |||||
| 2025-08-15 | 13F | Morgan Stanley | 225,072 | -1.90 | 5,278 | -9.98 | ||||
| 2025-08-12 | 13F | Integrated Advisors Network LLC | 0 | -100.00 | 0 | |||||
| 2025-08-12 | 13F | OneAscent Financial Services LLC | 23,737 | 1 | ||||||
| 2025-08-15 | 13F | Tower Research Capital LLC (TRC) | 0 | -100.00 | 0 | |||||
| 2025-07-17 | 13F | Jackson, Grant Investment Advisers, Inc. | 6,291 | 0.00 | 148 | -8.12 | ||||
| 2025-07-23 | 13F | Valmark Advisers, Inc. | 23,440 | 1.82 | 550 | -6.63 | ||||
| 2025-07-17 | 13F | Sound Income Strategies, LLC | 35 | 250.00 | 1 | |||||
| 2025-08-12 | 13F | Eley Financial Management, Inc | 174,591 | -0.56 | 4,094 | -9.22 | ||||
| 2025-07-30 | 13F | VCI Wealth Management LLC | 40,728 | 11.55 | 955 | 2.47 | ||||
| 2025-07-17 | 13F | Fee-Only Financial Planning, L.C. | 11,815 | 0.00 | 277 | -7.97 | ||||
| 2025-08-14 | 13F | Jane Street Group, Llc | 0 | -100.00 | 0 | |||||
| 2025-07-30 | 13F | Cullen/frost Bankers, Inc. | 8,226 | 909.33 | 193 | 860.00 | ||||
| 2025-08-12 | 13F | Founders Financial Alliance, LLC | 670 | 0.00 | 16 | -11.76 | ||||
| 2025-05-07 | 13F | Evermay Wealth Management Llc | 0 | -100.00 | 0 | -100.00 | ||||
| 2025-08-14 | 13F | Ameriprise Financial Inc | 171,746 | 12.89 | 4,027 | 3.98 | ||||
| 2025-08-05 | 13F | Simplex Trading, Llc | 9 | 0 | ||||||
| 2025-08-13 | 13F | WealthTrust Axiom LLC | 10,500 | 0.00 | 246 | -8.21 | ||||
| 2025-07-16 | 13F | Beaumont Financial Advisors, LLC | 17,577 | -6.17 | 412 | -13.81 | ||||
| 2025-08-12 | 13F | LPL Financial LLC | 774,486 | -1.88 | 18,162 | -9.95 | ||||
| 2025-08-06 | 13F | Maltin Wealth Management, Inc. | 105,128 | 6.27 | 2,465 | -2.45 | ||||
| 2025-08-06 | 13F | Commonwealth Equity Services, Llc | 1,421,526 | -6.72 | 33 | -13.16 | ||||
| 2025-08-14 | 13F | Royal Bank Of Canada | 55,665 | -11.23 | 1,305 | -18.54 | ||||
| 2025-04-21 | 13F | LifeGoal Wealth Advisors | 0 | -100.00 | 0 | |||||
| 2025-07-16 | 13F | Instrumental Wealth, Llc | 8,700 | 209 | ||||||
| 2025-07-29 | 13F | Tradewinds Capital Management, LLC | 651 | 0.93 | 15 | -6.25 | ||||
| 2025-07-31 | 13F | Glass Jacobson Investment Advisors llc | 49,807 | -1.40 | 1,168 | -3.07 | ||||
| 2025-08-01 | 13F | Rossby Financial, LCC | 474 | 0.00 | 11 | 10.00 | ||||
| 2025-07-16 | 13F | Castleview Partners, Llc | 20,537 | 8.10 | 482 | -0.82 | ||||
| 2025-07-22 | 13F | Mascoma Wealth Management LLC | 209 | 0.00 | 5 | -20.00 | ||||
| 2025-08-13 | 13F | Northern Trust Corp | 43,821 | 0.00 | 1,028 | -8.22 | ||||
| 2025-08-11 | 13F | Principal Securities, Inc. | 23,483 | -7.57 | 551 | -9.09 | ||||
| 2025-05-20 | 13F | Belpointe Asset Management LLC | 0 | -100.00 | 0 | |||||
| 2025-08-11 | 13F | Citigroup Inc | 31,625 | -3.54 | 742 | -11.47 |