Statistik Asas
| Pemilik Institusi | 372 total, 372 long only, 0 short only, 0 long/short - change of 5.71% MRQ |
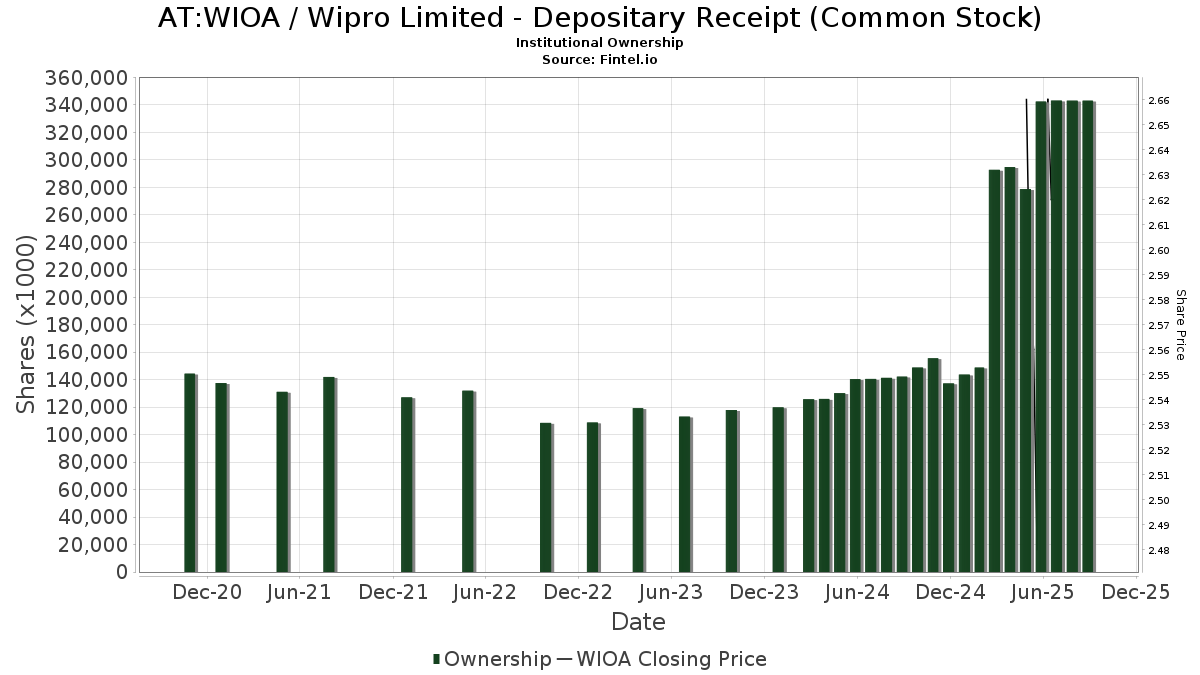
| Harga Saham | 2.52 |
| Purata Peruntukan Portfolio | 0.1281 % - change of -4.07% MRQ |
| Saham Institusi (Panjang) | 348,292,562 (ex 13D/G) - change of 57.99MM shares 20.34% MRQ |
| Nilai Institusi (Panjang) | $ 950,113 USD ($1000) |
Pemilikan Institusi dan Pemegang Saham
Wipro Limited - Depositary Receipt (Common Stock) (AT:WIOA) telah 372 pemilik institusi dan pemegang saham yang telah memfailkan borang 13D/G atau 13F dengan Suruhanjaya Bursa Sekuriti (SEC). Institusi ini memegang sejumlah 348,292,562 saham. Pemegang saham terbesar termasuk BlackRock, Inc., Vanguard Group Inc, State Street Corp, Acadian Asset Management Llc, Morgan Stanley, Millennium Management Llc, First Trust Advisors Lp, FVD - First Trust Value Line Dividend Index Fund, VGTSX - Vanguard Total International Stock Index Fund Investor Shares, and Bnp Paribas Arbitrage, Sa .
Wipro Limited - Depositary Receipt (Common Stock) (WBAG:WIOA) struktur pemilikan institusi menunjukkan kedudukan semasa dalam syarikat mengikut institusi dan dana serta perubahan terkini dalam saiz kedudukan. Pemegang saham utama boleh termasuk pelabur individu, dana amanah, dana lindung nilai atau institusi. Jadual 13D menunjukkan bahawa pelabur memegang (atau menahan) lebih daripada 5% syarikat dan berhasrat (atau berniat) untuk secara aktif meneruskan perubahan dalam strategi perniagaan. Jadual 13G menunjukkan pelaburan pasif melebihi 5%.
The share price as of July 10, 2025 is 2.52 / share. Previously, on May 9, 2025, the share price was 2.52 / share. This represents an increase of 0.00% over that period.
Skor Sentimen Dana
Skor Sentimen Dana (Skor Pengumpulan Pemilikan fka) mencari saham yang paling banyak dibeli oleh dana. Ia adalah hasil daripada model kuantitatif pelbagai faktor yang canggih yang mengenal pasti syarikat dengan tahap pengumpulan institusi tertinggi. Model pemarkahan ini menggunakan gabungan jumlah kenaikan dalam pemilik yang didedahkan, perubahan dalam peruntukan portfolio dalam pemilik tersebut dan metrik lain. Nombornya berjulat dari 0 hingga 100, dengan nombor yang lebih tinggi menunjukkan tahap pengumpulan yang lebih tinggi kepada rakannya, dan 50 adalah nombor purata.
Kekerapan Kemas Kini: Harian
Lihat Peneroka Pemilikan yang menyediakan senarai syarikat yang mempunyai kedudukan tertinggi.
Pemfailan 13F dan NPORT
Butiran mengenai pemfailan 13F adalah percuma. Perincian mengenai pemfailan NP memerlukan keahlian premium. Baris hijau menunjukkan kedudukan baharu. Baris merah menunjukkan kedudukan tertutup. Klik pautan ikon untuk melihat sejarah transaksi penuh.
Naik Taraf
untuk membuka data premium dan mengeksport ke Excel ![]() .
.
| Tarikh Fail | Sumber | Pelabur | Jenis | Purata Harga (Ang) |
Saham | ΔSaham (%) |
Nilai Dilaporkan ($1000) |
Δ Nilai (%) |
Peruntukan Port (%) |
|
|---|---|---|---|---|---|---|---|---|---|---|
| 2025-07-17 | 13F | Nelson, Van Denburg & Campbell Wealth Management Group, LLC | 53,818 | 1.77 | 163 | 0.62 | ||||
| 2025-06-26 | NP | BLACKROCK FUNDS - BlackRock Advantage Emerging Markets Fund Investor A Shares | 68,928 | 1,614.63 | 197 | 1,307.14 | ||||
| 2025-08-15 | 13F | Morgan Stanley | 20,786,088 | -22.03 | 62,774 | -23.05 | ||||
| 2025-08-05 | 13F | Ellevest, Inc. | 0 | -100.00 | 0 | |||||
| 2025-08-08 | 13F | Geode Capital Management, Llc | 107,021 | 14.27 | 323 | 12.94 | ||||
| 2025-05-13 | 13F | Triglav Skladi, D.o.o. | 0 | 0 | ||||||
| 2025-08-12 | 13F | Aigen Investment Management, Lp | 0 | -100.00 | 0 | |||||
| 2025-07-21 | 13F | Ameritas Advisory Services, LLC | 2 | 0 | ||||||
| 2025-08-14 | 13F | Evergreen Capital Management Llc | 134,483 | 325.18 | 406 | 322.92 | ||||
| 2025-08-14 | 13F | Ieq Capital, Llc | 121,079 | 26.11 | 366 | 24.57 | ||||
| 2025-08-08 | 13F | Creative Planning | 3,730,772 | 21.18 | 11,267 | 19.60 | ||||
| 2025-08-08 | 13F | Larson Financial Group LLC | 0 | -100.00 | 0 | -100.00 | ||||
| 2025-07-22 | 13F | Simplicity Wealth,LLC | 20,568 | 62 | ||||||
| 2025-08-14 | 13F | Atomi Financial Group, Inc. | 39,273 | -8.36 | 119 | -9.92 | ||||
| 2025-08-15 | 13F | WealthCollab, LLC | 14,616 | -24.09 | 44 | -24.14 | ||||
| 2025-08-28 | NP | NZAC - SPDR MSCI ACWI Low Carbon Target ETF | 32,960 | 4.89 | 100 | 3.13 | ||||
| 2025-07-28 | NP | AVEM - Avantis Emerging Markets Equity ETF This fund is a listed as child fund of American Century Companies Inc and if that institution has disclosed ownership in this security, then these positions will not be double counted when calculating total shares and total value | 2,061,435 | 20.83 | 5,937 | 6.42 | ||||
| 2025-07-17 | 13F | Sound Income Strategies, LLC | 32 | 0.00 | 0 | |||||
| 2025-08-07 | 13F | Zurcher Kantonalbank (Zurich Cantonalbank) | 172,048 | 0.00 | 520 | -1.33 | ||||
| 2025-08-14 | 13F | Citadel Advisors Llc | Put | 0 | -100.00 | 0 | ||||
| 2025-08-06 | 13F | Ovata Capital Management Ltd | 1,719,500 | -33.87 | 5,333 | -32.61 | ||||
| 2025-07-21 | 13F | Qrg Capital Management, Inc. | 123,313 | 78.78 | 372 | 76.30 | ||||
| 2025-07-28 | 13F | Ritholtz Wealth Management | 133,067 | -44.56 | 402 | -45.37 | ||||
| 2025-08-14 | 13F | Mercer Global Advisors Inc /adv | 71,574 | 0.78 | 216 | -0.46 | ||||
| 2025-08-06 | 13F | Penserra Capital Management LLC | 6,446,407 | 42.71 | 19 | 46.15 | ||||
| 2025-07-31 | 13F | MQS Management LLC | 0 | -100.00 | 0 | |||||
| 2025-08-04 | 13F | Creekmur Asset Management LLC | 0 | 0 | ||||||
| 2025-07-31 | 13F | BIP Alliance, LLC | 22,690 | -32.87 | 69 | -33.98 | ||||
| 2025-08-11 | 13F | Frank, Rimerman Advisors LLC | 420,008 | 3,247.21 | 1,268 | 3,236.84 | ||||
| 2025-08-04 | 13F | Simon Quick Advisors, Llc | 54,506 | -20.24 | 165 | -21.53 | ||||
| 2025-06-26 | NP | BLACKROCK FUNDS - BlackRock Defensive Advantage Emerging Markets Fund Institutional This fund is a listed as child fund of BlackRock, Inc. and if that institution has disclosed ownership in this security, then these positions will not be double counted when calculating total shares and total value | 21,515 | 0.00 | 62 | -21.79 | ||||
| 2025-08-05 | 13F | Crestwood Advisors Group LLC | 11,033 | -21.03 | 33 | -21.43 | ||||
| 2025-08-12 | 13F | Franklin Resources Inc | 67,306 | -9.03 | 203 | -10.18 | ||||
| 2025-08-13 | 13F | Centiva Capital, LP | 14,430 | -84.89 | 44 | -85.27 | ||||
| 2025-08-22 | NP | FEMR - Fidelity Enhanced Emerging Markets ETF | 47,684 | 0.00 | 144 | -0.69 | ||||
| 2025-07-29 | 13F | Angeles Wealth Management, Llc | 29,028 | 42.75 | 88 | 40.32 | ||||
| 2025-08-12 | 13F | Gitterman Wealth Management, LLC | 50,781 | -2.04 | 153 | -3.16 | ||||
| 2025-08-13 | 13F | Townsquare Capital Llc | 0 | -100.00 | 0 | |||||
| 2025-05-06 | 13F | Venturi Wealth Management, LLC | 0 | -100.00 | 0 | |||||
| 2025-05-09 | 13F | CoreCap Advisors, LLC | 0 | -100.00 | 0 | |||||
| 2025-08-14 | 13F | Balyasny Asset Management Llc | 29,370 | 89 | ||||||
| 2025-08-15 | 13F | Tower Research Capital LLC (TRC) | 718 | -95.18 | 2 | -95.56 | ||||
| 2025-08-14 | 13F | Tcw Group Inc | 303,720 | -18.55 | 917 | -19.56 | ||||
| 2025-05-14 | 13F | BI Asset Management Fondsmaeglerselskab A/S | 0 | -100.00 | 0 | |||||
| 2025-07-09 | 13F | Beacon Financial Group | 13,202 | 24.55 | 40 | 21.88 | ||||
| 2025-04-16 | 13F | Tobam | 0 | -100.00 | 0 | |||||
| 2025-08-13 | 13F | EverSource Wealth Advisors, LLC | 95,101 | -3.58 | 287 | -4.65 | ||||
| 2025-08-18 | 13F | Geneos Wealth Management Inc. | 344 | 1 | ||||||
| 2025-07-17 | 13F | Clean Yield Group | 1,330 | -19.10 | 4 | -20.00 | ||||
| 2025-08-13 | 13F | GeoWealth Management, LLC | 37,605 | 19.09 | 114 | 17.71 | ||||
| 2025-08-14 | 13F | Wellington Management Group Llp | 1,152,298 | 41.55 | 3,480 | 39.72 | ||||
| 2025-08-14 | 13F | Headlands Technologies LLC | 2,827 | 9 | ||||||
| 2025-08-13 | 13F | Cresset Asset Management, LLC | 55,883 | 10.19 | 169 | 8.39 | ||||
| 2025-08-13 | 13F | Guggenheim Capital Llc | 15,040 | 45 | ||||||
| 2025-06-30 | NP | VT - Vanguard Total World Stock Index Fund ETF Shares | 1,187,604 | 0.00 | 3,397 | -22.07 | ||||
| 2025-04-29 | NP | BELSX - Boston Partners Emerging Markets Long/Short Fund Institutional Class | 224,937 | 384.10 | 736 | 126.85 | ||||
| 2025-07-22 | 13F | Penobscot Investment Management Company, Inc. | 29,502 | 0.00 | 89 | -1.11 | ||||
| 2025-07-28 | 13F | Duncker Streett & Co Inc | 2 | 0.00 | 0 | |||||
| 2025-08-04 | 13F | Atria Investments Llc | 67,080 | 203 | ||||||
| 2025-05-14 | 13F | Susquehanna International Group, Llp | 0 | -100.00 | 0 | |||||
| 2025-07-15 | 13F | Compagnie Lombard Odier SCmA | 30,000 | 200.00 | 91 | 200.00 | ||||
| 2025-08-15 | 13F | Keel Point, LLC | 16,405 | -15.54 | 50 | -16.95 | ||||
| 2025-08-27 | NP | RYWTX - Emerging Markets 2x Strategy Fund Class A | 15,040 | 141.68 | 45 | 136.84 | ||||
| 2025-07-25 | 13F | Johnson Investment Counsel Inc | 36,600 | 111 | ||||||
| 2025-08-12 | 13F | Jpmorgan Chase & Co | 5,712,604 | -5.67 | 17,252 | -6.90 | ||||
| 2025-08-11 | 13F | Integrated Quantitative Investments LLC | 755,416 | 56.60 | 2,281 | 54.54 | ||||
| 2025-08-14 | 13F | Mariner, LLC | 610,892 | 15.97 | 1,845 | 14.53 | ||||
| 2025-08-14 | 13F | EP Wealth Advisors, Inc. | 20,210 | 61 | ||||||
| 2025-08-05 | 13F | Bank Of Montreal /can/ | 62,087 | 0.25 | 188 | -1.06 | ||||
| 2025-07-11 | 13F | Pinnacle Bancorp, Inc. | 681 | 0.00 | 2 | 0.00 | ||||
| 2025-08-14 | 13F | D. E. Shaw & Co., Inc. | 0 | -100.00 | 0 | |||||
| 2025-08-27 | NP | THRIVENT SERIES FUND INC - Thrivent Partner Emerging Markets Equity Portfolio Class A | 17,777 | 0.00 | 54 | -1.85 | ||||
| 2025-08-13 | 13F | Causeway Capital Management Llc | 475,731 | -2.67 | 1,437 | -3.95 | ||||
| 2025-08-08 | 13F | Bailard, Inc. | 13,016 | 0.00 | 39 | 0.00 | ||||
| 2025-08-11 | 13F | Nomura Asset Management Co Ltd | 0 | -100.00 | 0 | |||||
| 2025-07-28 | NP | VCGEX - Emerging Economies Fund | 203,748 | -64.47 | 587 | -68.75 | ||||
| 2025-08-12 | 13F | Enterprise Financial Services Corp | 36,893 | 33.76 | 111 | 32.14 | ||||
| 2025-08-13 | 13F | Congress Wealth Management LLC / DE / | 12,871 | 39 | ||||||
| 2025-07-25 | 13F | Cwm, Llc | 37,654 | -5.27 | 0 | |||||
| 2025-07-28 | NP | NSI - National Security Emerging Markets Index ETF | 16,417 | 38.46 | 47 | 23.68 | ||||
| 2025-07-18 | 13F | Robeco Institutional Asset Management B.V. | 4,270,701 | 3.58 | 12,898 | 2.22 | ||||
| 2025-07-18 | 13F | Ewa, Llc | 15,869 | 2.71 | 48 | 0.00 | ||||
| 2025-07-23 | 13F | Prime Capital Investment Advisors, LLC | 26,850 | -19.91 | 81 | -20.59 | ||||
| 2025-07-18 | 13F | BSW Wealth Partners | 164,147 | 1.77 | 496 | 0.41 | ||||
| 2025-07-24 | 13F | Callan Family Office, LLC | 10,592 | 0.00 | 32 | -3.12 | ||||
| 2025-07-28 | 13F | Harbour Investments, Inc. | 994 | 0.00 | 3 | 0.00 | ||||
| 2025-08-08 | 13F | Pnc Financial Services Group, Inc. | 258,942 | 20.43 | 782 | 19.03 | ||||
| 2025-08-13 | 13F | Natixis Advisors, L.p. | 128,806 | -42.73 | 0 | |||||
| 2025-07-28 | NP | AVEEX - Avantis Emerging Markets Equity Fund Institutional Class This fund is a listed as child fund of American Century Companies Inc and if that institution has disclosed ownership in this security, then these positions will not be double counted when calculating total shares and total value | 128,256 | 0.00 | 369 | -11.93 | ||||
| 2025-08-26 | NP | FVD - First Trust Value Line Dividend Index Fund This fund is a listed as child fund of First Trust Advisors Lp and if that institution has disclosed ownership in this security, then these positions will not be double counted when calculating total shares and total value | 12,492,106 | -4.20 | 37,726 | -5.45 | ||||
| 2025-08-13 | 13F | Walleye Capital LLC | 0 | -100.00 | 0 | |||||
| 2025-08-14 | 13F | Ubs Asset Management Americas Inc | 529,661 | 11.80 | 1,600 | 10.35 | ||||
| 2025-08-12 | 13F | Rhumbline Advisers | 2,511,726 | -5.88 | 7,585 | -7.11 | ||||
| 2025-08-26 | NP | MASTER INVESTMENT PORTFOLIO - Total International ex U.S. Index Master Portfolio | 26,368 | 0.00 | 80 | -1.25 | ||||
| 2025-07-17 | 13F | HB Wealth Management, LLC | 53,733 | 12.23 | 162 | 10.96 | ||||
| 2025-08-05 | 13F | Simplex Trading, Llc | Call | 0 | -100.00 | 0 | ||||
| 2025-08-13 | 13F | Bare Financial Services, Inc | 201 | 0.00 | 1 | |||||
| 2025-08-14 | 13F | Bank Of America Corp /de/ | 7,690,677 | 298.91 | 23,226 | 293.71 | ||||
| 2025-07-23 | 13F | Canopy Partners, LLC | 91,653 | -6.67 | 277 | -8.00 | ||||
| 2025-08-06 | 13F | SOUTH STATE Corp | 0 | -100.00 | 0 | |||||
| 2025-08-13 | 13F | Flow Traders U.s. Llc | 30,504 | 0 | ||||||
| 2025-07-24 | 13F | PDS Planning, Inc | 186,269 | -8.45 | 563 | -9.65 | ||||
| 2025-08-05 | 13F | Key FInancial Inc | 1,516 | 0.00 | 5 | 0.00 | ||||
| 2025-05-15 | 13F/A | Clear Street Llc | Call | 0 | -100.00 | 0 | -100.00 | |||
| 2025-07-25 | 13F | Sequoia Financial Advisors, LLC | 582,930 | 55.85 | 1,760 | 53.85 | ||||
| 2025-07-31 | 13F | R Squared Ltd | 27,810 | 15.97 | 84 | 13.70 | ||||
| 2025-08-14 | 13F | XY Capital Ltd | 412,899 | 142.03 | 1,247 | 138.70 | ||||
| 2025-08-06 | 13F | Harvest Portfolios Group Inc. | 119,813 | -22.65 | 362 | -23.68 | ||||
| 2025-08-13 | 13F | Mount Yale Investment Advisors, LLC | 0 | -100.00 | 0 | |||||
| 2025-08-14 | 13F | Laird Norton Trust Company, Llc | 218,877 | -3.19 | 661 | -4.34 | ||||
| 2025-08-07 | 13F | Allworth Financial LP | 17,976 | 19.72 | 54 | 28.57 | ||||
| 2025-08-25 | 13F/A | Neuberger Berman Group LLC | 207,629 | 1,265.62 | 627 | 1,263.04 | ||||
| 2025-08-12 | 13F | American Century Companies Inc | 2,308,388 | 19.57 | 6,971 | 18.01 | ||||
| 2025-06-26 | NP | DFEM - Dimensional Emerging Markets Core Equity 2 ETF | 166,457 | 4.85 | 476 | -18.21 | ||||
| 2025-07-10 | 13F | Kozak & Associates, Inc. | 1 | 0.00 | 0 | |||||
| 2025-07-25 | 13F | CBOE Vest Financial, LLC | 10,108 | 31 | ||||||
| 2025-07-14 | 13F | Abound Wealth Management | 483 | 7.10 | 1 | 0.00 | ||||
| 2025-08-14 | 13F | Optiver Holding B.V. | 1,086 | -71.10 | 3 | -72.73 | ||||
| 2025-08-13 | 13F | Arrowstreet Capital, Limited Partnership | 2,364,490 | -21.07 | 7,141 | -22.10 | ||||
| 2025-06-26 | NP | DFEV - Dimensional Emerging Markets Value ETF | 398,733 | 4.28 | 1,140 | -18.75 | ||||
| 2025-08-14 | 13F | Vident Advisory, LLC | 1,306,934 | -18.76 | 3,947 | -19.83 | ||||
| 2025-08-14 | 13F | Raymond James Financial Inc | 79,132 | -84.36 | 239 | -84.63 | ||||
| 2025-08-13 | 13F | Fisher Asset Management, LLC | 7,020,730 | -2.77 | 21,203 | -4.04 | ||||
| 2025-07-28 | NP | AVXC - Avantis Emerging Markets ex-China Equity ETF | 25,872 | 37.50 | 75 | 21.31 | ||||
| 2025-08-27 | 13F/A | Squarepoint Ops LLC | 464,313 | -17.51 | 1,402 | -18.58 | ||||
| 2025-08-12 | 13F | Catalyst Funds Management Pty Ltd | 42,600 | 129 | ||||||
| 2025-08-14 | 13F | Jane Street Group, Llc | 613,629 | 173.41 | 1,853 | 170.12 | ||||
| 2025-08-12 | 13F | CIBC Private Wealth Group, LLC | 3,126 | 9 | ||||||
| 2025-08-14 | 13F | Two Sigma Securities, Llc | 21,758 | -74.87 | 66 | -75.38 | ||||
| 2025-08-13 | 13F | Russell Investments Group, Ltd. | 145,860 | 0.16 | 443 | 0.45 | ||||
| 2025-08-08 | 13F | Cetera Investment Advisers | 0 | -100.00 | 0 | |||||
| 2025-08-29 | NP | JVANX - International Equity Index Trust NAV | 88,126 | 0.00 | 266 | -1.12 | ||||
| 2025-08-11 | 13F | Vanguard Group Inc | 23,322,712 | -0.13 | 70,435 | -1.43 | ||||
| 2025-08-13 | 13F | Northern Trust Corp | 5,264,810 | -8.70 | 15,900 | -9.90 | ||||
| 2025-08-13 | 13F | Hsbc Holdings Plc | 365,231 | 21.64 | 1,103 | 20.15 | ||||
| 2025-08-13 | 13F | Hsbc Holdings Plc | Call | 90,000 | 0.00 | 275 | 0.00 | |||
| 2025-08-05 | 13F | Simplex Trading, Llc | 7,293 | 0 | ||||||
| 2025-05-13 | 13F | Horizon Investments, LLC | 0 | -100.00 | 0 | |||||
| 2025-08-07 | 13F | Connor, Clark & Lunn Investment Management Ltd. | 6,236,294 | -13.71 | 18,834 | -14.84 | ||||
| 2025-08-13 | 13F | Twin Peaks Wealth Advisors, LLC | 1,322 | 4 | ||||||
| 2025-08-13 | 13F | Grantham, Mayo, Van Otterloo & Co. LLC | 47,408 | -73.03 | 143 | -73.37 | ||||
| 2025-08-07 | 13F | Parkside Financial Bank & Trust | 4,085 | 174.90 | 12 | 200.00 | ||||
| 2025-08-14 | 13F | Van Eck Associates Corp | 270,276 | -23.29 | 1 | -100.00 | ||||
| 2025-05-12 | 13F | Quantinno Capital Management LP | 0 | -100.00 | 0 | |||||
| 2025-08-14 | 13F | UBS Group AG | 4,922,565 | 224.43 | 14,866 | 220.25 | ||||
| 2025-07-17 | 13F | CogentBlue Wealth Advisors, LLC | 14,347 | 19.41 | 43 | 19.44 | ||||
| 2025-05-05 | 13F | Lindbrook Capital, Llc | 102,514 | 2.60 | 314 | -11.33 | ||||
| 2025-08-14 | 13F | Mml Investors Services, Llc | 156,431 | 20.95 | 0 | |||||
| 2025-08-12 | 13F | XTX Topco Ltd | 108,544 | 328 | ||||||
| 2025-07-29 | NP | SGLIX - SGI Global Equity Fund Class I Shares | 373,738 | 118.31 | 1,076 | 92.49 | ||||
| 2025-06-25 | NP | TDVI - FT Vest Technology Dividend Target Income ETF | 7,414 | 21 | ||||||
| 2025-05-19 | NP | EISAX - Carillon ClariVest International Stock Fund A | 453,966 | 0.00 | 1,389 | -13.57 | ||||
| 2025-07-29 | 13F | Private Trust Co Na | 0 | -100.00 | 0 | |||||
| 2025-08-14 | 13F | Ameriprise Financial Inc | 32,261 | -22.67 | 97 | -23.62 | ||||
| 2025-07-21 | 13F | Mirae Asset Global Investments Co., Ltd. | 99,086 | 8.06 | 299 | 7.94 | ||||
| 2025-08-07 | 13F | Sierra Ocean, Llc | 8,169 | 1.44 | 25 | 0.00 | ||||
| 2025-07-16 | 13F | Kathmere Capital Management, LLC | 0 | -100.00 | 0 | |||||
| 2025-07-30 | 13F | DekaBank Deutsche Girozentrale | 75,049 | 0.00 | 0 | |||||
| 2025-06-26 | NP | HFIGX - Hartford Schroders Diversified Growth Fund Class I | 21,075 | 7.38 | 60 | -16.67 | ||||
| 2025-07-11 | 13F | Essex Savings Bank | 23,966 | -1.47 | 72 | -2.70 | ||||
| 2025-08-14 | 13F | Toroso Investments, LLC | 27,260 | 19.26 | 82 | 18.84 | ||||
| 2025-07-16 | 13F | Perigon Wealth Management, LLC | 11,204 | -25.71 | 34 | -28.26 | ||||
| 2025-07-28 | 13F | BRYN MAWR TRUST Co | 1,398 | -48.98 | 4 | -50.00 | ||||
| 2025-08-04 | 13F | Haven Private, LLC | 12,887 | 39 | ||||||
| 2025-08-14 | 13F | Erste Asset Management GmbH | 81,064 | 246 | ||||||
| 2025-08-29 | NP | MPLAX - Praxis International Index Fund Class A | 1,510,909 | 0.00 | 4,563 | -1.32 | ||||
| 2025-05-14 | 13F | Huntington National Bank | 0 | -100.00 | 0 | |||||
| 2025-05-15 | 13F | CAPROCK Group, Inc. | 321,328 | 5.56 | 983 | -8.73 | ||||
| 2025-08-14 | 13F | Promethos Capital, LLC | 3,313,678 | 6.30 | 10,005 | 4.89 | ||||
| 2025-08-13 | 13F | Mirabella Financial Services Llp | 0 | -100.00 | 0 | |||||
| 2025-08-14 | 13F | Hrt Financial Lp | 380,501 | 28.58 | 1 | |||||
| 2025-09-04 | 13F/A | Advisor Group Holdings, Inc. | 3,874 | 60.02 | 12 | 57.14 | ||||
| 2025-05-16 | 13F/A | Kestra Investment Management, LLC | 0 | -100.00 | 0 | |||||
| 2025-08-12 | 13F | Deutsche Bank Ag\ | 828,978 | 6.76 | 2,504 | 5.39 | ||||
| 2025-08-14 | 13F | Xponance, Inc. | 59,076 | 1.12 | 178 | 0.00 | ||||
| 2025-08-14 | 13F | Bnp Paribas | 0 | -100.00 | 8 | 14.29 | ||||
| 2025-07-15 | 13F | Ballentine Partners, LLC | 615,645 | 18.00 | 1,859 | 16.48 | ||||
| 2025-05-08 | 13F | Aspiring Ventures, LLC | 0 | -100.00 | 0 | -100.00 | ||||
| 2025-08-18 | 13F/A | Nomura Holdings Inc | 378,992 | -20.88 | 1,145 | -21.91 | ||||
| 2025-08-25 | NP | LEGR - First Trust Indxx Innovative Transaction & Process ETF This fund is a listed as child fund of First Trust Advisors Lp and if that institution has disclosed ownership in this security, then these positions will not be double counted when calculating total shares and total value | 428,786 | 5.38 | 1,295 | 3.94 | ||||
| 2025-08-06 | 13F | Hoxton Planning & Management, LLC | 0 | -100.00 | 0 | |||||
| 2025-08-13 | 13F | First Trust Advisors Lp | 15,336,970 | -1.37 | 46,318 | -2.66 | ||||
| 2025-08-12 | 13F | CenterBook Partners LP | 0 | -100.00 | 0 | -100.00 | ||||
| 2025-08-08 | 13F | Vestcor Inc | 495,016 | -51.71 | 1 | -66.67 | ||||
| 2025-08-07 | 13F | Boston Partners | 0 | -100.00 | 0 | |||||
| 2025-08-14 | 13F | Lighthouse Investment Partners, LLC | 259,677 | 784 | ||||||
| 2025-08-29 | NP | FRDM - Freedom 100 Emerging Markets ETF | 102,881 | 16.68 | 311 | 15.24 | ||||
| 2025-08-13 | 13F | West Family Investments, Inc. | 533,167 | 37.35 | 1,610 | 35.64 | ||||
| 2025-08-12 | 13F | MAI Capital Management | 67,948 | 205 | ||||||
| 2025-08-14 | 13F | Principal Street Partners, LLC | 41,134 | 186.89 | 124 | 188.37 | ||||
| 2025-08-13 | 13F | Panagora Asset Management Inc | 88,576 | 0.00 | 268 | -1.48 | ||||
| 2025-08-11 | 13F | Morling Financial Advisors, LLC | 0 | -100.00 | 0 | |||||
| 2025-07-14 | 13F | Abacus Wealth Partners, LLC | 34,703 | 5.21 | 105 | 4.00 | ||||
| 2025-07-14 | 13F | Cherrydale Wealth Management, Llc | 26,838 | -34.12 | 81 | -34.68 | ||||
| 2025-07-30 | 13F | Drive Wealth Management, Llc | 33,000 | -11.35 | 100 | -12.39 | ||||
| 2025-08-18 | 13F/A | National Bank Of Canada /fi/ | 4,317 | 13 | ||||||
| 2025-08-11 | 13F | NewEdge Wealth, LLC | 1,148,027 | 45.58 | 3,054 | 26.52 | ||||
| 2025-08-12 | 13F | Longfellow Investment Management Co Llc | 386,152 | 0.00 | 1,166 | -1.27 | ||||
| 2025-05-29 | NP | JAJBX - Emerging Markets Value Trust Series I | 86,551 | -75.88 | 265 | -79.21 | ||||
| 2025-08-01 | 13F | Bessemer Group Inc | 51,250 | 1.59 | 0 | |||||
| 2025-05-15 | 13F | Amplify Investments, Llc | 0 | -100.00 | 0 | |||||
| 2025-08-14 | 13F | Goldman Sachs Group Inc | 4,539,391 | -56.16 | 13,709 | -56.73 | ||||
| 2025-07-30 | 13F | Ethic Inc. | 1,036,451 | -1.37 | 3,151 | -2.02 | ||||
| 2025-07-29 | NP | RBB FUND, INC. - Aquarius International Fund | 250,530 | 17.69 | 722 | 3.59 | ||||
| 2025-08-08 | 13F | Candriam Luxembourg S.C.A. | 0 | -100.00 | 0 | |||||
| 2025-07-30 | 13F | Rehmann Capital Advisory Group | 13,175 | 40 | ||||||
| 2025-06-30 | NP | VEU - Vanguard FTSE All-World ex-US Index Fund ETF Shares | 3,090,356 | -1.17 | 8,838 | -22.99 | ||||
| 2025-08-12 | 13F | Virtu Financial LLC | 0 | -100.00 | 0 | |||||
| 2025-08-13 | 13F | Shelton Capital Management | 293,575 | -28.30 | 887 | -29.23 | ||||
| 2025-08-12 | 13F | AIMZ Investment Advisors, LLC | 293,646 | 0.00 | 887 | -1.34 | ||||
| 2025-08-13 | 13F | Quadrant Capital Group Llc | 1,221,439 | 60.75 | 3,689 | 58.62 | ||||
| 2025-08-11 | 13F | Principal Securities, Inc. | 683 | 79.74 | 2 | 100.00 | ||||
| 2025-06-26 | NP | DEXC - Dimensional Emerging Markets ex China Core Equity ETF | 31,462 | 22.35 | 90 | -5.32 | ||||
| 2025-07-31 | 13F | Resonant Capital Advisors, LLC | 32,705 | 99 | ||||||
| 2025-08-14 | 13F/A | Barclays Plc | 4,535 | -84.61 | 0 | |||||
| 2025-08-06 | 13F | Savant Capital, LLC | 0 | -100.00 | 0 | |||||
| 2025-08-14 | 13F | Smartleaf Asset Management LLC | 1,111 | -60.71 | 3 | -62.50 | ||||
| 2025-08-07 | 13F | Evoke Wealth, Llc | 10,883 | 33 | ||||||
| 2025-08-12 | 13F | Segall Bryant & Hamill, Llc | 202,200 | 0.00 | 611 | -1.29 | ||||
| 2025-08-28 | NP | JINTX - Johnson International Fund | 36,600 | 111 | ||||||
| 2025-08-13 | 13F | Victory Capital Management Inc | 396,805 | 0.00 | 1,198 | -1.32 | ||||
| 2025-07-25 | 13F | We Are One Seven, LLC | 23,206 | 16.64 | 70 | 16.67 | ||||
| 2025-06-27 | NP | HAOSX - Harbor Overseas Fund Institutional Class | 100,639 | 0.00 | 288 | -22.22 | ||||
| 2025-05-13 | 13F | Freestone Capital Holdings, LLC | 0 | -100.00 | 0 | |||||
| 2025-07-21 | 13F | Empirical Financial Services, LLC d.b.a. Empirical Wealth Management | 50,709 | 85.94 | 153 | 84.34 | ||||
| 2025-08-13 | 13F | Lido Advisors, LLC | 19,883 | 2.20 | 60 | 1.69 | ||||
| 2025-08-14 | 13F | Colony Group, LLC | 95,809 | 58.22 | 289 | 56.22 | ||||
| 2025-04-28 | NP | JEVNX - Emerging Markets Fund Class NAV | 271,691 | 144.93 | 888 | 14.58 | ||||
| 2025-08-27 | NP | THRIVENT SERIES FUND INC - Thrivent International Allocation Portfolio Class A | 40,069 | 0.00 | 121 | -0.82 | ||||
| 2025-08-14 | 13F | State Street Corp | 22,803,389 | 3.38 | 68,866 | 2.03 | ||||
| 2025-08-14 | 13F | Old Mission Capital Llc | 0 | -100.00 | 0 | -100.00 | ||||
| 2025-07-31 | 13F | Caitong International Asset Management Co., Ltd | 408 | 1 | ||||||
| 2025-08-14 | 13F | Aquatic Capital Management LLC | 954,746 | 41.32 | 2,883 | 39.48 | ||||
| 2025-08-14 | 13F | Qube Research & Technologies Ltd | 1,375,186 | 97.82 | 4,153 | 95.25 | ||||
| 2025-08-14 | 13F | Boston Private Wealth Llc | 19,831 | -74.45 | 60 | -75.11 | ||||
| 2025-08-14 | 13F | Two Sigma Advisers, Lp | 176,600 | 0.00 | 533 | -1.30 | ||||
| 2025-08-11 | 13F | Cladis Investment Advisory, LLC | 19,680 | 0.00 | 59 | -1.67 | ||||
| 2025-06-27 | NP | SUNAMERICA SERIES TRUST - SA JPMorgan Emerging Markets Portfolio Class 1 | 637,824 | 50.02 | 1,824 | 16.92 | ||||
| 2025-07-28 | 13F | Allianz Asset Management GmbH | 1,643,982 | -20.70 | 4,965 | -21.75 | ||||
| 2025-07-16 | 13F | Signaturefd, Llc | 569,477 | -0.55 | 1,720 | -1.88 | ||||
| 2025-08-13 | 13F | Rsm Us Wealth Management Llc | 19,468 | -22.41 | 59 | -23.68 | ||||
| 2025-06-26 | NP | DFAE - Dimensional Emerging Core Equity Market ETF | 210,127 | 42.27 | 601 | 10.70 | ||||
| 2025-07-31 | 13F | Buckingham Strategic Partners | 17,887 | 10.05 | 54 | 10.20 | ||||
| 2025-08-13 | 13F | Pinpoint Asset Management (Singapore) Pte. Ltd. | 238,148 | 719 | ||||||
| 2025-07-24 | 13F | Jfs Wealth Advisors, Llc | 1,978 | -16.82 | 6 | -28.57 | ||||
| 2025-08-12 | 13F | Dimensional Fund Advisors Lp | 2,035,558 | 2.99 | 6,147 | 1.64 | ||||
| 2025-07-24 | 13F | Us Bancorp \de\ | 937,293 | 17.09 | 2,831 | 15.56 | ||||
| 2025-08-12 | 13F | BlackRock, Inc. | 55,182,597 | -10.76 | 166,651 | -11.93 | ||||
| 2025-08-05 | 13F | NewSquare Capital LLC | 4,134 | 130.69 | 12 | 140.00 | ||||
| 2025-08-11 | 13F | TD Waterhouse Canada Inc. | 2,356 | 7 | ||||||
| 2025-08-11 | 13F | Pinnacle Wealth Planning Services, Inc. | 93,406 | -15.26 | 282 | -16.32 | ||||
| 2025-07-09 | 13F | Dynamic Advisor Solutions LLC | 30,587 | 3.97 | 92 | 2.22 | ||||
| 2025-08-13 | 13F | Avestar Capital, LLC | 11,463 | -11.65 | 35 | -12.82 | ||||
| 2025-08-14 | 13F | Man Group plc | 663,369 | -36.17 | 2,003 | -37.01 | ||||
| 2025-07-29 | 13F | Nordea Investment Management Ab | 1,295,941 | -0.62 | 3,933 | 0.05 | ||||
| 2025-08-14 | 13F | Point72 Asset Management, L.P. | 595,189 | 1,797 | ||||||
| 2025-08-14 | 13F | Millennium Management Llc | 16,922,437 | 137.87 | 51,106 | 134.76 | ||||
| 2025-07-23 | 13F | Klp Kapitalforvaltning As | 14,300 | 16.26 | 43 | 16.22 | ||||
| 2025-07-23 | NP | DBEM - Xtrackers MSCI Emerging Markets Hedged Equity ETF | 12,024 | 14.51 | 35 | 0.00 | ||||
| 2025-08-15 | 13F | CI Private Wealth, LLC | 1,101,406 | 101.86 | 3,326 | 99.28 | ||||
| 2025-08-12 | 13F | SRS Capital Advisors, Inc. | 12,245 | 297.31 | 37 | 300.00 | ||||
| 2025-05-08 | 13F | Waldron Private Wealth LLC | 0 | -100.00 | 0 | |||||
| 2025-08-12 | 13F | Clear Street Markets Llc | 13,820 | 42 | ||||||
| 2025-07-14 | 13F | Ridgewood Investments LLC | 7,114 | 0.00 | 21 | 0.00 | ||||
| 2025-08-13 | 13F | Schroder Investment Management Group | 7,932,834 | -7.42 | 23,957 | -7.73 | ||||
| 2025-08-25 | NP | EMSQX - Shelton Emerging Markets Fund Institutional Shares | 215,400 | -23.45 | 651 | -24.51 | ||||
| 2025-08-08 | 13F | Mitsubishi UFJ Trust & Banking Corp | 45,146 | 0.00 | 136 | -1.45 | ||||
| 2025-04-29 | 13F | Hm Payson & Co | 325,376 | 0.00 | 996 | -13.55 | ||||
| 2025-08-07 | 13F | Profund Advisors Llc | 66,219 | 15.23 | 200 | 13.71 | ||||
| 2025-07-15 | 13F | Public Employees Retirement System Of Ohio | 364,047 | -23.70 | 1,099 | -24.67 | ||||
| 2025-08-14 | 13F | Wetherby Asset Management Inc | 1,120,415 | 0.67 | 3,384 | -14.12 | ||||
| 2025-07-09 | 13F | Aaron Wealth Advisors LLC | 17,934 | 0.00 | 54 | 0.00 | ||||
| 2025-07-10 | 13F | Fulton Bank, N.a. | 0 | -100.00 | 0 | |||||
| 2025-08-01 | 13F | SYM FINANCIAL Corp | 23,850 | 13.13 | 72 | 12.50 | ||||
| 2025-07-28 | NP | AVSE - Avantis Responsible Emerging Markets Equity ETF | 18,324 | 13.24 | 53 | 0.00 | ||||
| 2025-08-11 | 13F | Banque Cantonale Vaudoise | 33,250 | -4.03 | 0 | |||||
| 2025-08-14 | 13F | RMB Capital Management, LLC | 10,297 | 31 | ||||||
| 2025-07-30 | NP | APIE - ActivePassive International Equity ETF | 248,243 | -34.75 | 715 | -42.60 | ||||
| 2025-08-11 | 13F | Brown Brothers Harriman & Co | 3,524 | 11 | ||||||
| 2025-07-30 | 13F | Cullen/frost Bankers, Inc. | 25,192 | 0.00 | 76 | -1.30 | ||||
| 2025-08-14 | 13F | Sei Investments Co | 195,048 | 73.61 | 589 | 71.72 | ||||
| 2025-08-12 | 13F | Putnam Fl Investment Management Co | 14,875 | 12.04 | 45 | 10.00 | ||||
| 2025-08-14 | 13F | Federation des caisses Desjardins du Quebec | 97,984 | 10.81 | 296 | 9.26 | ||||
| 2025-07-23 | 13F | Optas, LLC | 25,610 | -38.01 | 77 | -38.89 | ||||
| 2025-08-14 | 13F | Bnp Paribas Arbitrage, Sa | 9,965,693 | 17.25 | 30,096 | 15.72 | ||||
| 2025-08-11 | 13F | EntryPoint Capital, LLC | 55,987 | -3.71 | 169 | -4.52 | ||||
| 2025-08-14 | 13F | LMR Partners LLP | 1,417,767 | 174.67 | 4,282 | 171.12 | ||||
| 2025-07-31 | 13F | Sage Mountain Advisors LLC | 10,756 | -26.07 | 32 | -27.27 | ||||
| 2025-08-07 | 13F | Legacy Advisors, LLC | 0 | -100.00 | 0 | |||||
| 2025-08-14 | 13F | Citadel Advisors Llc | Call | 10,800 | 191.89 | 33 | 190.91 | |||
| 2025-08-14 | 13F | Citadel Advisors Llc | 3,874,129 | 602.25 | 11,700 | 593.07 | ||||
| 2025-06-30 | NP | VGTSX - Vanguard Total International Stock Index Fund Investor Shares | 11,574,656 | 0.00 | 33,104 | -22.07 | ||||
| 2025-04-17 | 13F | Vista Wealth Management Group, LLC | 19,084 | -14.89 | 58 | -26.58 | ||||
| 2025-08-14 | 13F | Schonfeld Strategic Advisors LLC | 107,445 | -61.19 | 324 | -61.75 | ||||
| 2025-08-11 | 13F | Johnson Financial Group, LLC | 0 | -100.00 | 0 | |||||
| 2025-08-01 | 13F | Oversea-Chinese Banking CORP Ltd | 95,930 | -21.69 | 290 | -22.73 | ||||
| 2025-08-12 | 13F | Proequities, Inc. | Put | 0 | 0 | |||||
| 2025-08-13 | 13F | Truvestments Capital Llc | 9 | 0 | ||||||
| 2025-08-12 | 13F | Proequities, Inc. | Call | 0 | 0 | |||||
| 2025-08-12 | 13F | Proequities, Inc. | 0 | 0 | ||||||
| 2025-08-11 | 13F | Dorsey & Whitney Trust CO LLC | 21,471 | 1.11 | 65 | 0.00 | ||||
| 2025-07-16 | 13F | Badgley Phelps Wealth Managers, LLC | 12,000 | 0.00 | 36 | 0.00 | ||||
| 2025-08-26 | NP | MASTER INVESTMENT PORTFOLIO - Active Stock Master Portfolio Active Stock Portfolio | 108,519 | -39.22 | 328 | -40.11 | ||||
| 2025-08-12 | 13F | O'shaughnessy Asset Management, Llc | 616,061 | -30.11 | 1,861 | -31.03 | ||||
| 2025-07-23 | 13F/A | Euro Pacific Asset Management, LLC | 24,025 | 1.63 | 0 | |||||
| 2025-05-02 | 13F | Cable Hill Partners, LLC | 73,683 | -16.30 | 211 | -32.48 | ||||
| 2025-08-13 | 13F | Invesco Ltd. | 748,175 | 40.70 | 2,259 | 38.84 | ||||
| 2025-08-14 | 13F | Aprio Wealth Management, LLC | 11,537 | -86.14 | 35 | -86.61 | ||||
| 2025-07-25 | 13F | Yousif Capital Management, Llc | 159,478 | 0.00 | 482 | -1.43 | ||||
| 2025-08-12 | 13F | Barings Llc | 32,833 | 19.38 | 99 | 17.86 | ||||
| 2025-08-14 | 13F | Group One Trading, L.p. | Call | 4,500 | -91.62 | 14 | -92.07 | |||
| 2025-08-14 | 13F | Glenmede Investment Management, LP | 69,300 | 209 | ||||||
| 2025-07-11 | 13F | Diversified Trust Co | 77,777 | -10.46 | 235 | -11.70 | ||||
| 2025-04-29 | 13F | BOCHK Asset Management Ltd | 0 | -100.00 | 0 | -100.00 | ||||
| 2025-07-14 | 13F | UMA Financial Services, Inc. | 2,939 | 68.81 | 9 | 60.00 | ||||
| 2025-07-31 | 13F | Oppenheimer & Co Inc | 21,000 | 0.00 | 63 | -1.56 | ||||
| 2025-08-04 | 13F | Flagship Harbor Advisors, Llc | 18,693 | 5.49 | 56 | 3.70 | ||||
| 2025-05-14 | 13F/A | Group One Trading, L.p. | 0 | -100.00 | 0 | -100.00 | ||||
| 2025-05-15 | 13F | Glenmede Trust Co Na | 66,571 | -13.24 | 204 | -25.09 | ||||
| 2025-08-13 | 13F | Quantbot Technologies LP | 449,449 | 40.53 | 1,357 | 38.75 | ||||
| 2025-08-04 | 13F | Migdal Insurance & Financial Holdings Ltd. | 0 | -100.00 | 0 | |||||
| 2025-06-26 | NP | Thrivent Core Funds - Thrivent Core Emerging Markets Equity Fund | 159,305 | -38.10 | 456 | -77.00 | ||||
| 2025-08-07 | 13F | Vise Technologies, Inc. | 27,547 | -48.53 | 83 | -56.08 | ||||
| 2025-06-26 | NP | DFAX - Dimensional World ex U.S. Core Equity 2 ETF | 54,604 | 0.00 | 156 | -22.00 | ||||
| 2025-08-14 | 13F | Fmr Llc | 317,862 | -34.08 | 960 | -34.98 | ||||
| 2025-07-17 | 13F | Greenleaf Trust | 75,084 | -58.59 | 227 | -59.21 | ||||
| 2025-08-19 | 13F | Asset Dedication, LLC | 0 | -100.00 | 0 | |||||
| 2025-08-06 | 13F | Atlas Legacy Advisors, LLC | 0 | -100.00 | 0 | |||||
| 2025-08-12 | 13F | LPL Financial LLC | 505,670 | 184.51 | 1,527 | 181.22 | ||||
| 2025-08-26 | NP | SBHEX - Segall Bryant & Hamill Emerging Markets Fund Retail Class | 53,800 | 0.00 | 162 | -1.22 | ||||
| 2025-06-27 | NP | SPWO - SP Funds S&P World (ex-US) ETF | 24,615 | 38.43 | 70 | 7.69 | ||||
| 2025-07-08 | 13F | Parallel Advisors, LLC | 217,517 | -19.20 | 657 | -20.29 | ||||
| 2025-07-17 | 13F | V-Square Quantitative Management LLC | 307,830 | 76.32 | 930 | 73.97 | ||||
| 2025-08-12 | 13F | Pathstone Holdings, LLC | 447,468 | 10.04 | 1,351 | 8.43 | ||||
| 2025-08-05 | 13F | Bridgewater Advisors Inc. | 181,567 | 5.66 | 508 | 3.04 | ||||
| 2025-07-09 | 13F | Sivia Capital Partners, LLC | 128,826 | -9.21 | 389 | -10.37 | ||||
| 2025-07-31 | 13F | CNB Bank | 575 | 2 | ||||||
| 2025-08-25 | NP | NXTG - First Trust Indxx NextG ETF This fund is a listed as child fund of First Trust Advisors Lp and if that institution has disclosed ownership in this security, then these positions will not be double counted when calculating total shares and total value | 1,545,153 | 27.27 | 4,666 | 25.63 | ||||
| 2025-07-30 | NP | EDOG - ALPS Emerging Sector Dividend Dogs ETF | 413,851 | 17.00 | 1,192 | 3.03 | ||||
| 2025-07-16 | 13F | Highline Wealth Partners Llc | 910 | -26.14 | 3 | -33.33 | ||||
| 2025-08-28 | NP | GMF - SPDR(R) S&P(R) EMERGING ASIA PACIFIC ETF | 323,579 | -6.51 | 977 | -7.74 | ||||
| 2025-08-28 | NP | SPGM - SPDR(R) Portfolio MSCI Global Stock Market ETF | 189,366 | 2.96 | 572 | 1.60 | ||||
| 2025-07-25 | 13F | JustInvest LLC | 1,202,675 | 11.30 | 3,634 | 9.89 | ||||
| 2025-08-05 | 13F | Westside Investment Management, Inc. | 9,218 | 28 | ||||||
| 2025-08-07 | 13F | HighPoint Advisor Group LLC | 13,941 | 14.99 | 42 | 23.53 | ||||
| 2025-08-11 | 13F | Alps Advisors Inc | 439,551 | 5.37 | 1,327 | 4.00 | ||||
| 2025-05-01 | 13F | Bleakley Financial Group, LLC | 0 | -100.00 | 0 | |||||
| 2025-08-12 | 13F | Global Retirement Partners, LLC | 10,514 | 110.62 | 32 | 82.35 | ||||
| 2025-07-25 | 13F | Allspring Global Investments Holdings, LLC | 34,812 | -87.30 | 107 | -87.35 | ||||
| 2025-08-29 | NP | SA FUNDS INVESTMENT TRUST - SA Emerging Markets Value Fund | 29,490 | 0.00 | 89 | -1.11 | ||||
| 2025-08-14 | 13F | Graham Capital Management, L.P. | 0 | -100.00 | 0 | |||||
| 2025-08-25 | NP | TDIV - First Trust NASDAQ Technology Dividend Index Fund This fund is a listed as child fund of First Trust Advisors Lp and if that institution has disclosed ownership in this security, then these positions will not be double counted when calculating total shares and total value | 328,471 | 27.64 | 992 | 25.92 | ||||
| 2025-08-25 | NP | SISLX - Shelton International Select Equity Fund Investor Class | 78,175 | -38.96 | 236 | -39.64 | ||||
| 2025-08-04 | 13F | GAM Holding AG | 0 | -100.00 | 0 | |||||
| 2025-08-14 | 13F | Royal Bank Of Canada | 983,981 | 717.05 | 2,972 | 705.42 | ||||
| 2025-08-12 | 13F | Summit Global Investments | 373,738 | 20.63 | 1 | |||||
| 2025-08-14 | 13F | GWM Advisors LLC | 384,408 | 42.00 | 1,161 | 40.10 | ||||
| 2025-08-14 | 13F | Newport Capital Group, LLC | 30,246 | 1.10 | 91 | 0.00 | ||||
| 2025-08-28 | NP | SPEM - SPDR(R) Portfolio Emerging Markets ETF | 5,785,545 | 8.80 | 17,472 | 7.38 | ||||
| 2025-08-15 | 13F | Kestra Advisory Services, LLC | 14,331 | 43 | ||||||
| 2025-07-29 | 13F | Werba Rubin Papier Wealth Management | 0 | -100.00 | 0 | |||||
| 2025-07-09 | 13F | Intelligence Driven Advisers, LLC | 26,273 | 44.04 | 79 | 43.64 | ||||
| 2025-08-11 | 13F | Citigroup Inc | 1,363,049 | 27.26 | 4,116 | 25.60 | ||||
| 2025-06-26 | NP | DFSE - Dimensional Emerging Markets Sustainability Core 1 ETF | 17,072 | 0.00 | 49 | -22.58 | ||||
| 2025-08-21 | NP | DGIN - VanEck Digital India ETF | 258,460 | -24.10 | 781 | -25.14 | ||||
| 2025-08-13 | 13F | Renaissance Technologies Llc | 2,577,200 | 85.22 | 7,783 | 82.83 | ||||
| 2025-07-11 | 13F | Farther Finance Advisors, LLC | 5,582 | -31.93 | 17 | -36.00 | ||||
| 2025-05-01 | 13F | Schechter Investment Advisors, LLC | 143,270 | -29.86 | 438 | -39.42 | ||||
| 2025-07-16 | 13F | Augustine Asset Management Inc | 59,809 | 0.00 | 181 | -1.64 | ||||
| 2025-04-22 | 13F | PFG Investments, LLC | 0 | -100.00 | 0 | |||||
| 2025-06-23 | NP | UUPIX - Ultraemerging Markets Profund Investor Class | 11,939 | 12.05 | 34 | -12.82 | ||||
| 2025-07-25 | 13F | Natural Investments, Llc | 42,464 | 21.30 | 0 | |||||
| 2025-08-04 | 13F | Assetmark, Inc | 1,062 | 11.09 | 3 | 50.00 | ||||
| 2025-07-14 | 13F | Foster Group, Inc. | 77,171 | -16.89 | 233 | -17.96 | ||||
| 2025-07-22 | 13F | Sava Infond d.o.o. | 320,000 | 0.00 | 966 | -1.33 | ||||
| 2025-07-11 | 13F | Perpetual Ltd | 1,146,200 | 39.73 | 3,462 | 37.89 | ||||
| 2025-08-04 | 13F | Mayflower Financial Advisors, LLC | 21,496 | -11.67 | 65 | -13.51 | ||||
| 2025-08-05 | 13F | Tiaa Trust, National Association | 17,712 | 0.00 | 53 | -1.85 | ||||
| 2025-08-14 | 13F | Modern Wealth Management, LLC | 111,558 | -44.23 | 337 | -45.10 | ||||
| 2025-07-08 | 13F | E. Ohman J:or Asset Management AB | 179,000 | 0.00 | 541 | -1.28 | ||||
| 2025-08-15 | 13F | Captrust Financial Advisors | 10,619 | -18.75 | 32 | -17.95 | ||||
| 2025-07-24 | 13F | Ronald Blue Trust, Inc. | 102,911 | -2.49 | 311 | -3.73 | ||||
| 2025-08-12 | 13F | Coldstream Capital Management Inc | 99,117 | 592.93 | 299 | 595.35 | ||||
| 2025-08-21 | NP | IEQ - Lazard International Dynamic Equity ETF | 43,942 | 133 | ||||||
| 2025-08-28 | NP | SSGVX - State Street Global Equity ex-U.S. Index Portfolio State Street Global All Cap Equity ex-U.S. Index Portfolio This fund is a listed as child fund of State Street Corp and if that institution has disclosed ownership in this security, then these positions will not be double counted when calculating total shares and total value | 38,108 | 0.00 | 115 | -0.86 | ||||
| 2025-06-30 | NP | VEIEX - Vanguard Emerging Markets Stock Index Fund Investor Shares | 6,545,438 | 0.00 | 18,720 | -22.07 | ||||
| 2025-08-26 | NP | Profunds - Profund Vp Emerging Markets | 48,255 | 8.38 | 146 | 6.62 | ||||
| 2025-07-21 | 13F | Ascent Group, LLC | 46,173 | -6.16 | 139 | -7.33 | ||||
| 2025-07-09 | 13F | Fragasso Group Inc. | 14,806 | 3.32 | 45 | 2.33 | ||||
| 2025-08-14 | 13F | Barometer Capital Management Inc. | 91,800 | -3.67 | 272 | -6.87 | ||||
| 2025-08-06 | 13F | Quadrant Private Wealth Management, LLC | 20,392 | 62 | ||||||
| 2025-05-22 | NP | RODE - Hartford Multifactor Diversified International ETF | 27,860 | 399.10 | 85 | 325.00 | ||||
| 2025-08-14 | 13F | Ariadne Wealth Management, LP | 41,231 | 115 | ||||||
| 2025-07-16 | 13F | Ascent Capital Management, LLC | 25,482 | 67.22 | 77 | 65.22 | ||||
| 2025-08-12 | 13F | Legal & General Group Plc | 121,521 | 14.55 | 368 | 12.92 | ||||
| 2025-07-14 | 13F | GAMMA Investing LLC | 44,969 | 110.76 | 136 | 107.69 | ||||
| 2025-07-30 | 13F | Eqis Capital Management, Inc. | 136,816 | -9.06 | 413 | -10.22 | ||||
| 2025-08-13 | 13F | Marshall Wace, Llp | 5,625,794 | -38.27 | 16,990 | -39.07 | ||||
| 2025-08-11 | 13F | HighTower Advisors, LLC | 58,166 | -3.94 | 176 | -5.41 | ||||
| 2025-08-01 | 13F | Envestnet Asset Management Inc | 10,290 | -21.26 | 31 | -20.51 | ||||
| 2025-07-23 | 13F | High Note Wealth, LLC | 0 | -100.00 | 0 | |||||
| 2025-07-24 | 13F | Lester Murray Antman dba SimplyRich | 303,074 | -6.92 | 1 | |||||
| 2025-08-14 | 13F | Aqr Capital Management Llc | 787,270 | -13.29 | 2,378 | -13.15 | ||||
| 2025-08-12 | 13F | Prudential Financial Inc | 740,200 | 8.92 | 4,974 | 8.94 | ||||
| 2025-08-14 | 13F | Cubist Systematic Strategies, LLC | 424,029 | -73.11 | 1,281 | -73.47 | ||||
| 2025-07-24 | 13F | Leo Wealth, LLC | 13,471 | 13.28 | 41 | 11.11 | ||||
| 2025-06-26 | NP | SNTKX - Steward International Enhanced Index Fund Class A | 168,148 | 0.00 | 481 | -22.20 | ||||
| 2025-07-24 | 13F | IFP Advisors, Inc | 1,178 | 0.00 | 4 | 0.00 | ||||
| 2025-05-28 | NP | IEAIX - Lazard International Equity Advantage Portfolio Institutional Shares | 81,007 | 248 | ||||||
| 2025-08-14 | 13F | Hamilton Capital, LLC | 0 | -100.00 | 0 | |||||
| 2025-08-14 | 13F | Lazard Asset Management Llc | 3,660,147 | -13.45 | 11 | -8.33 | ||||
| 2025-08-11 | 13F | United Capital Financial Advisers, Llc | 77,833 | -8.26 | 235 | -9.27 | ||||
| 2025-08-13 | 13F | Northwestern Mutual Wealth Management Co | 2,089 | 0.48 | 6 | 0.00 | ||||
| 2025-08-13 | 13F | Cerity Partners LLC | 896,714 | -7.63 | 2,708 | -8.82 | ||||
| 2025-08-14 | 13F/A | Skopos Labs, Inc. | 309 | -86.86 | 1 | -100.00 | ||||
| 2025-08-14 | 13F | Wells Fargo & Company/mn | 15,123 | -0.94 | 46 | -2.17 | ||||
| 2025-04-24 | NP | OAEM - OneAscent Emerging Markets ETF | 278,093 | 58.62 | 909 | -25.80 | ||||
| 2025-06-26 | NP | TWAAX - Thrivent International Allocation Fund Class A | 21,659 | -39.20 | 62 | -77.66 | ||||
| 2025-05-22 | NP | ROAM - Hartford Multifactor Emerging Markets ETF | 36,197 | 94.34 | 111 | 69.23 | ||||
| 2025-07-25 | 13F | Verdence Capital Advisors LLC | 44,596 | -29.02 | 135 | -30.21 | ||||
| 2025-08-14 | 13F | Caisse De Depot Et Placement Du Quebec | 0 | -100.00 | 0 | |||||
| 2025-07-25 | 13F | Clarendon Private LLC | 0 | -100.00 | 0 | |||||
| 2025-07-25 | NP | ACWV - iShares Edge MSCI Min Vol Global ETF | 441,708 | -3.38 | 1,272 | -14.86 | ||||
| 2025-08-07 | 13F | Acadian Asset Management Llc | 21,841,995 | 4.12 | 66 | 1.56 | ||||
| 2025-08-14 | 13F | Verition Fund Management LLC | 908,335 | 2,743 | ||||||
| 2025-07-08 | 13F | Northwest & Ethical Investments L.P. | 0 | -100.00 | 0 | -100.00 | ||||
| 2025-07-29 | 13F | Wealthstream Advisors, Inc. | 69,630 | 11.18 | 210 | 9.95 | ||||
| 2025-08-08 | 13F | Crossmark Global Holdings, Inc. | 201,705 | -0.15 | 609 | -1.46 | ||||
| 2025-08-13 | 13F | Jump Financial, LLC | 325,502 | 983 | ||||||
| 2025-08-22 | NP | QTUM - Defiance Quantum ETF | 6,446,407 | 42.49 | 19,468 | 40.63 | ||||
| 2025-07-22 | 13F | LGT Group Foundation | 91,090 | 0.00 | 275 | -1.08 | ||||
| 2025-05-15 | 13F | Angeles Investment Advisors, LLC | 0 | -100.00 | 0 | |||||
| 2025-04-11 | 13F | First Affirmative Financial Network | 29,385 | -9.25 | 90 | -21.93 | ||||
| 2025-08-05 | 13F | Bank of New York Mellon Corp | 43,546 | -38.56 | 132 | -39.35 | ||||
| 2025-08-11 | 13F | Bell Investment Advisors, Inc | 7,102 | -2.20 | 21 | -4.55 | ||||
| 2025-05-30 | NP | SEEM - SEI Select Emerging Markets Equity ETF | 112,500 | 344 | ||||||
| 2025-07-09 | 13F | Sunpointe, LLC | 11,248 | -14.88 | 34 | -17.50 |