Statistik Asas
| Pemilik Institusi | 347 total, 334 long only, 4 short only, 9 long/short - change of -1.42% MRQ |
| Purata Peruntukan Portfolio | 0.2404 % - change of -6.14% MRQ |
| Saham Diterbitkan | shares (source: Capital IQ) |
| Saham Institusi (Panjang) | 79,759,657 - 44.46% (ex 13D/G) - change of 34.91MM shares 77.82% MRQ |
| Nilai Institusi (Panjang) | $ 930,259 USD ($1000) |
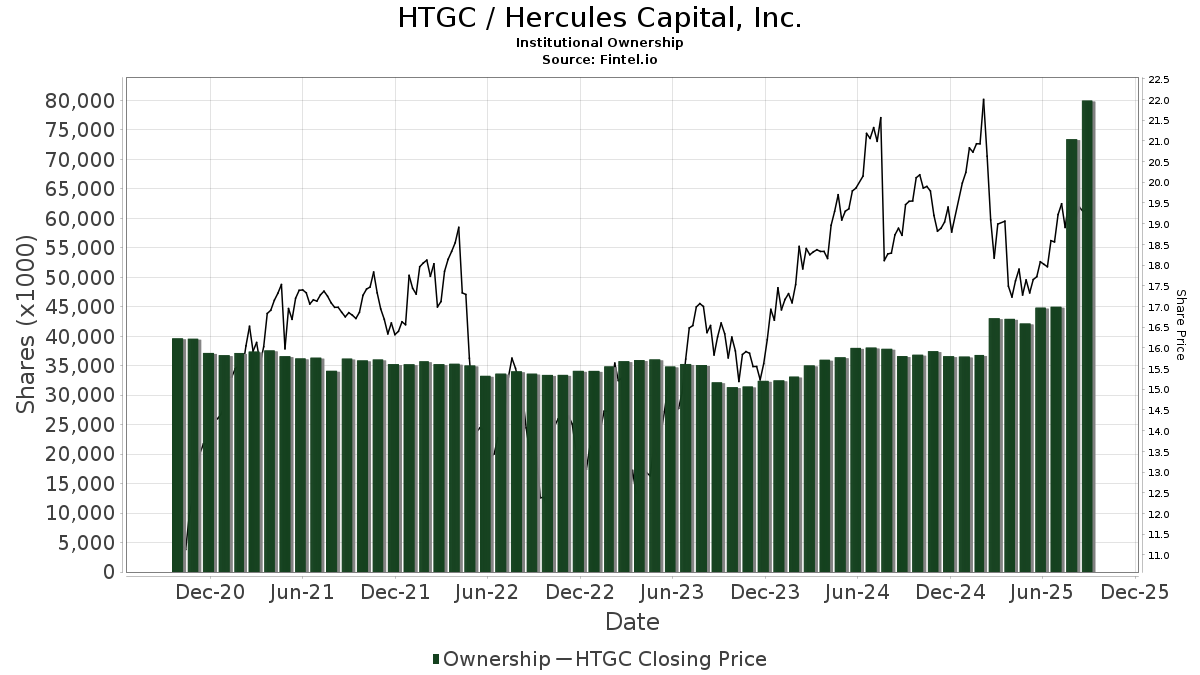
Pemilikan Institusi dan Pemegang Saham
Hercules Capital, Inc. (US:HTGC) telah 347 pemilik institusi dan pemegang saham yang telah memfailkan borang 13D/G atau 13F dengan Suruhanjaya Bursa Sekuriti (SEC). Institusi ini memegang sejumlah 79,763,103 saham. Pemegang saham terbesar termasuk Kingstone Capital Partners Texas, LLC, Van Eck Associates Corp, BIZD - VanEck Vectors BDC Income ETF, Sound Income Strategies, LLC, Millennium Management Llc, Two Sigma Advisers, Lp, Morgan Stanley, Two Sigma Investments, Lp, LPL Financial LLC, and Legal & General Group Plc .
Hercules Capital, Inc. (NYSE:HTGC) struktur pemilikan institusi menunjukkan kedudukan semasa dalam syarikat mengikut institusi dan dana serta perubahan terkini dalam saiz kedudukan. Pemegang saham utama boleh termasuk pelabur individu, dana amanah, dana lindung nilai atau institusi. Jadual 13D menunjukkan bahawa pelabur memegang (atau menahan) lebih daripada 5% syarikat dan berhasrat (atau berniat) untuk secara aktif meneruskan perubahan dalam strategi perniagaan. Jadual 13G menunjukkan pelaburan pasif melebihi 5%.
The share price as of September 5, 2025 is 19.23 / share. Previously, on September 6, 2024, the share price was 18.55 / share. This represents an increase of 3.67% over that period.
Skor Sentimen Dana
Skor Sentimen Dana (Skor Pengumpulan Pemilikan fka) mencari saham yang paling banyak dibeli oleh dana. Ia adalah hasil daripada model kuantitatif pelbagai faktor yang canggih yang mengenal pasti syarikat dengan tahap pengumpulan institusi tertinggi. Model pemarkahan ini menggunakan gabungan jumlah kenaikan dalam pemilik yang didedahkan, perubahan dalam peruntukan portfolio dalam pemilik tersebut dan metrik lain. Nombornya berjulat dari 0 hingga 100, dengan nombor yang lebih tinggi menunjukkan tahap pengumpulan yang lebih tinggi kepada rakannya, dan 50 adalah nombor purata.
Kekerapan Kemas Kini: Harian
Lihat Peneroka Pemilikan yang menyediakan senarai syarikat yang mempunyai kedudukan tertinggi.
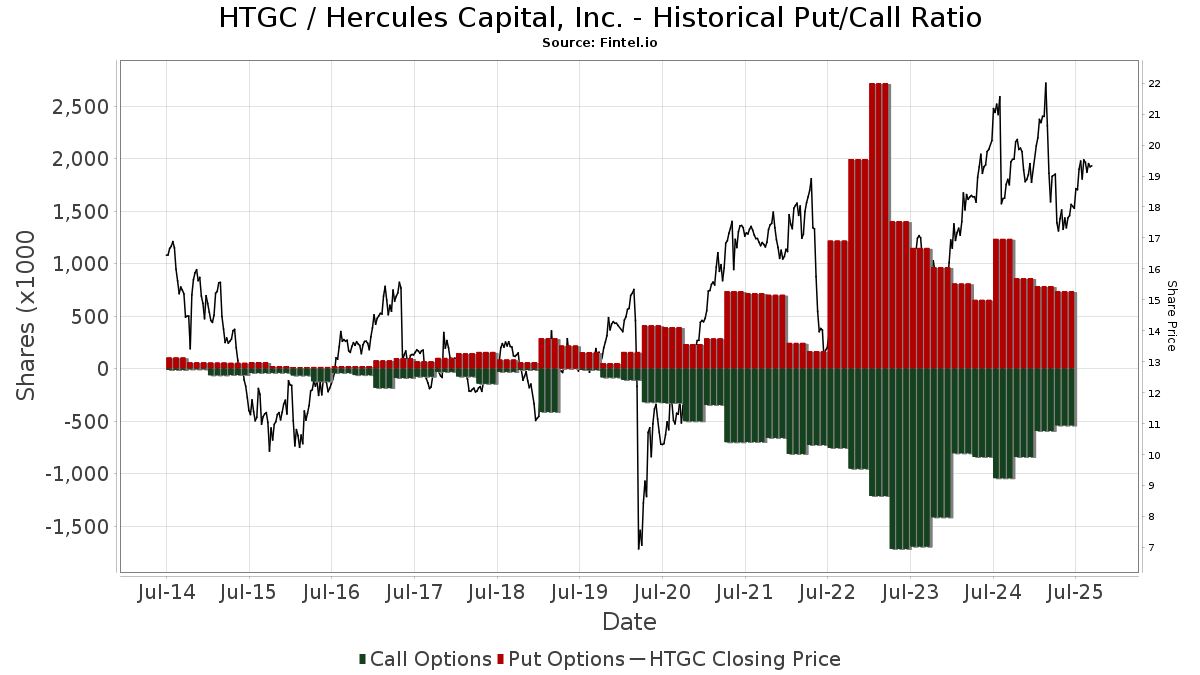
Nisbah Put/Call Institusi
Selain melaporkan isu ekuiti dan hutang standard, institusi yang mempunyai lebih daripada 100MM aset di bawah pengurusan juga mesti mendedahkan pegangan opsyen jual dan beli mereka. Memandangkan opsyen jual secara amnya menunjukkan sentimen negatif, dan opsyen beli menunjukkan sentimen positif, kita boleh mendapatkan gambaran keseluruhan sentimen institusi dengan merencanakan nisbah jual kepada beli. Carta di sebelah kanan memplotkan nisbah jual/beli sejarah untuk instrumen ini.
Menggunakan Nisbah Put/Callsebagai penunjuk sentimen pelabur mengatasi salah satu kekurangan utama menggunakan jumlah pemilikan institusi, iaitu sejumlah besar aset di bawah pengurusan dilaburkan secara pasif untuk menjejaki indeks. Dana yang diurus secara pasif biasanya tidak membeli opsyen, jadi penunjuk nisbah put/call mengekori rapat sentimen dana yang diurus secara aktif.
Pemfailan 13F dan NPORT
Butiran mengenai pemfailan 13F adalah percuma. Perincian mengenai pemfailan NP memerlukan keahlian premium. Baris hijau menunjukkan kedudukan baharu. Baris merah menunjukkan kedudukan tertutup. Klik pautan ikon untuk melihat sejarah transaksi penuh.
Naik Taraf
untuk membuka data premium dan mengeksport ke Excel ![]() .
.
| Tarikh Fail | Sumber | Pelabur | Jenis | Purata Harga (Ang) |
Saham | ΔSaham (%) |
Nilai Dilaporkan ($1000) |
Δ Nilai (%) |
Peruntukan Port (%) |
|
|---|---|---|---|---|---|---|---|---|---|---|
| 2025-08-14 | 13F | Citadel Advisors Llc | 664,210 | -47.43 | 12,142 | -49.98 | ||||
| 2025-07-08 | 13F | RMR Wealth Builders | 19,655 | 2.20 | 359 | -2.71 | ||||
| 2025-08-15 | 13F | WealthCollab, LLC | 836 | 30.42 | 15 | 25.00 | ||||
| 2025-07-22 | 13F | IMC-Chicago, LLC | Put | 12,000 | 219 | |||||
| 2025-05-15 | 13F | CAPROCK Group, Inc. | 14,200 | 0.00 | 273 | -4.56 | ||||
| 2025-07-16 | 13F | Beaumont Financial Advisors, LLC | 12,240 | 2.47 | 224 | -2.62 | ||||
| 2025-07-23 | 13F | Hager Investment Management Services, Llc | 50 | 2.04 | 1 | |||||
| 2025-08-27 | NP | JNL SERIES TRUST - JNL Multi-Manager Alternative Fund (A) | Short | -2,297 | 219.03 | -42 | 215.38 | |||
| 2025-07-24 | 13F | Monument Capital Management | 15,534 | -5.40 | 284 | -10.16 | ||||
| 2025-07-29 | 13F | Private Trust Co Na | 3,381 | 576.20 | 62 | 577.78 | ||||
| 2025-05-02 | 13F | Wealthfront Advisers Llc | 0 | -100.00 | 0 | -100.00 | ||||
| 2025-07-22 | 13F | IMC-Chicago, LLC | Call | 38,400 | 124.56 | 702 | 113.72 | |||
| 2025-08-14 | 13F | Citadel Advisors Llc | Put | 206,900 | -1.80 | 3,782 | -6.55 | |||
| 2025-08-19 | 13F | Asset Dedication, LLC | 756 | 0.00 | 14 | -7.14 | ||||
| 2025-08-08 | 13F | Avantax Advisory Services, Inc. | 13,484 | 2.70 | 246 | -2.38 | ||||
| 2025-08-14 | 13F | Citadel Advisors Llc | Call | 25,700 | 59.63 | 470 | 51.78 | |||
| 2025-08-07 | 13F | Acadian Asset Management Llc | 1,520 | 9.91 | 0 | |||||
| 2025-08-01 | 13F | First National Trust Co | 19,634 | 0.00 | 359 | -5.04 | ||||
| 2025-08-01 | 13F | Pasadena Private Wealth, LLC | 18,440 | 1.10 | 337 | -3.71 | ||||
| 2025-07-08 | 13F | Nbc Securities, Inc. | 710 | 0.00 | 0 | |||||
| 2025-07-08 | 13F | Zrc Wealth Management, Llc | 1,778 | 2.24 | 32 | -3.03 | ||||
| 2025-08-06 | 13F | Prospera Financial Services Inc | 10,078 | 184 | ||||||
| 2025-08-08 | 13F | Hartland & Co., LLC | 0 | -100.00 | 0 | |||||
| 2025-06-18 | NP | Putnam ETF Trust - Putnam BDC ETF - | 646,141 | 43.99 | 11,566 | 21.85 | ||||
| 2025-07-30 | 13F | Principle Wealth Partners Llc | 19,385 | 0.00 | 354 | -4.84 | ||||
| 2025-08-13 | 13F | Jump Financial, LLC | 263,509 | 1,308.16 | 4,817 | 1,241.50 | ||||
| 2025-07-22 | 13F | MAS Advisors LLC | 20,992 | 3.59 | 384 | -1.54 | ||||
| 2025-07-17 | 13F | Beacon Capital Management, LLC | 835 | 2.58 | 15 | 0.00 | ||||
| 2025-05-12 | 13F | Fmr Llc | 0 | -100.00 | 0 | |||||
| 2025-07-25 | 13F | Concurrent Investment Advisors, LLC | 32,993 | 15.37 | 603 | 9.84 | ||||
| 2025-08-01 | 13F | Rossby Financial, LCC | 969 | 0.00 | 18 | 0.00 | ||||
| 2025-08-07 | 13F | ProShare Advisors LLC | 30,389 | 1.51 | 556 | -3.48 | ||||
| 2025-08-14 | 13F | Atom Investors LP | 388,483 | 582.77 | 7,101 | 549.68 | ||||
| 2025-07-18 | 13F | PFG Investments, LLC | 109,832 | -1.99 | 2,008 | -6.74 | ||||
| 2025-07-10 | 13F | Capital Advisory Group Advisory Services, LLC | 90,904 | 4.42 | 1,662 | -0.66 | ||||
| 2025-08-15 | 13F | CI Private Wealth, LLC | 55,252 | 112.89 | 1,010 | 102.81 | ||||
| 2025-07-28 | 13F | Melia Wealth LLC | 793,586 | 4.08 | 14,507 | -0.96 | ||||
| 2025-08-01 | 13F | Y-Intercept (Hong Kong) Ltd | 97,439 | 210.35 | 1,781 | 195.36 | ||||
| 2025-08-12 | 13F | Cornerstone Wealth Management, LLC | 20,440 | -12.91 | 374 | -17.11 | ||||
| 2025-07-28 | 13F/A | Penbrook Management LLC | 14,563 | -41.71 | 266 | -44.47 | ||||
| 2025-07-17 | 13F | Sound Income Strategies, LLC | 2,930,340 | 1.94 | 53,567 | -2.99 | ||||
| 2025-08-13 | 13F | Truvestments Capital Llc | 211,138 | -0.09 | 3,860 | -4.93 | ||||
| 2025-08-14 | 13F | Goldman Sachs Group Inc | 382,964 | 971.53 | 7,001 | 920.41 | ||||
| 2025-08-08 | 13F | Creative Planning | 36,100 | -32.56 | 660 | -35.89 | ||||
| 2025-07-16 | 13F | Signature Resources Capital Management, LLC | 275 | 0.00 | 5 | 0.00 | ||||
| 2025-08-11 | 13F | Nomura Asset Management Co Ltd | 15,017 | -1.04 | 275 | -5.84 | ||||
| 2025-08-15 | 13F | Kestra Advisory Services, LLC | 38,115 | 15.52 | 697 | 9.95 | ||||
| 2025-08-06 | 13F | S&t Bank/pa | 288,396 | -5.95 | 5,272 | -10.51 | ||||
| 2025-08-12 | 13F | Legal & General Group Plc | 1,253,204 | 6.56 | 22,909 | 1.38 | ||||
| 2025-08-13 | 13F | Guggenheim Capital Llc | 31,365 | 5.60 | 573 | 0.53 | ||||
| 2025-05-09 | 13F | GeoWealth Management, LLC | 0 | -100.00 | 0 | |||||
| 2025-07-21 | 13F | Catalina Capital Group, LLC | 0 | -100.00 | 0 | |||||
| 2025-08-12 | 13F | Mcdonald Partners Llc | 48,000 | 0.00 | 877 | -4.88 | ||||
| 2025-07-30 | 13F | Denali Advisors Llc | 333,853 | -2.11 | 6,103 | -6.85 | ||||
| 2025-08-13 | 13F | EverSource Wealth Advisors, LLC | 322 | 0.31 | 6 | -16.67 | ||||
| 2025-05-13 | 13F | Beach Point Capital Management LP | Put | 0 | -100.00 | 0 | ||||
| 2025-08-13 | 13F | Mackenzie Financial Corp | 22,482 | 0.89 | 411 | -4.21 | ||||
| 2025-07-25 | NP | First Trust Specialty Finance & Financial Opportunities Fund This fund is a listed as child fund of First Trust Advisors Lp and if that institution has disclosed ownership in this security, then these positions will not be double counted when calculating total shares and total value | 330,000 | 0.00 | 5,818 | -15.70 | ||||
| 2025-08-14 | 13F | Sand Hill Global Advisors, LLC | 15,503 | 17.85 | 283 | 12.30 | ||||
| 2025-07-22 | 13F | Diligent Investors, LLC | 28,005 | 14.39 | 512 | 8.72 | ||||
| 2025-08-12 | 13F | William B. Walkup & Associates, Inc. | 229 | 0.00 | 4 | 0.00 | ||||
| 2025-08-08 | 13F | Foundations Investment Advisors, LLC | 25,170 | -29.53 | 460 | -32.94 | ||||
| 2025-08-13 | 13F | Invesco Ltd. | 78,951 | 1.61 | 1,443 | -3.28 | ||||
| 2025-08-04 | 13F | Assetmark, Inc | 1,386 | 173.37 | 25 | 177.78 | ||||
| 2025-07-18 | 13F | Trust Co Of Vermont | 825 | 15 | ||||||
| 2025-08-07 | 13F | Hennion & Walsh Asset Management, Inc. | 36,798 | -58.43 | 673 | -60.47 | ||||
| 2025-07-21 | 13F | Future Financial Wealth Managment LLC | 30,375 | -0.57 | 555 | -5.29 | ||||
| 2025-08-14 | 13F | Engineers Gate Manager LP | 240,946 | 115.67 | 4,404 | 105.22 | ||||
| 2025-04-22 | 13F | Duncker Streett & Co Inc | 0 | -100.00 | 0 | -100.00 | ||||
| 2025-08-14 | 13F | Two Sigma Investments, Lp | Put | 146,900 | 51.76 | 2,685 | 44.43 | |||
| 2025-08-14 | 13F | Two Sigma Investments, Lp | 1,320,316 | 4.37 | 24,135 | -0.69 | ||||
| 2025-07-31 | 13F | Cambridge Investment Research Advisors, Inc. | 164,755 | 7.58 | 3 | 50.00 | ||||
| 2025-08-06 | 13F | Wedbush Securities Inc | 14,734 | 6.67 | 0 | |||||
| 2025-08-14 | 13F | Point72 Asset Management, L.P. | 36,299 | 67.66 | 664 | 59.76 | ||||
| 2025-08-14 | 13F/A | Barclays Plc | 102,522 | 42.98 | 2 | 0.00 | ||||
| 2025-08-25 | 13F/A | Neuberger Berman Group LLC | 349,374 | 192.48 | 6,387 | 178.38 | ||||
| 2025-08-13 | 13F | OMERS ADMINISTRATION Corp | 0 | -100.00 | 0 | |||||
| 2025-08-11 | 13F | Private Advisor Group, LLC | 125,405 | -10.79 | 2,292 | -15.11 | ||||
| 2025-08-14 | 13F | Colony Group, LLC | 12,807 | -18.67 | 234 | -22.52 | ||||
| 2025-08-14 | 13F | FIL Ltd | 0 | -100.00 | 0 | |||||
| 2025-08-13 | 13F | Advisory Research Inc | 11,948 | -0.72 | 218 | -5.63 | ||||
| 2025-08-11 | 13F | Empowered Funds, LLC | 20,950 | -8.33 | 383 | -12.98 | ||||
| 2025-07-28 | 13F | Harbour Investments, Inc. | 19,410 | -8.56 | 355 | -13.02 | ||||
| 2025-08-14 | 13F | FJ Capital Management LLC | 150,435 | 60.33 | 2,750 | 52.55 | ||||
| 2025-08-14 | 13F | Optiver Holding B.V. | 2,020 | 0.00 | 37 | -5.26 | ||||
| 2025-08-14 | 13F | AllSquare Wealth Management LLC | 1,500 | 50.00 | 27 | 42.11 | ||||
| 2025-05-13 | 13F | Raymond James Financial Inc | Put | 0 | -100.00 | 0 | -100.00 | |||
| 2025-07-09 | 13F | Mirador Capital Partners LP | 45,600 | 4.39 | 834 | -0.72 | ||||
| 2025-08-14 | 13F | Integrated Wealth Concepts LLC | 20,106 | 16.62 | 368 | 10.88 | ||||
| 2025-07-24 | 13F | Us Bancorp \de\ | 41,970 | -1.67 | 767 | -6.35 | ||||
| 2025-08-07 | 13F | Americana Partners, LLC | 32,250 | 590 | ||||||
| 2025-08-11 | 13F | Elequin Capital Lp | 66 | 1 | ||||||
| 2025-08-29 | 13F | Centaurus Financial, Inc. | 37,144 | 1 | ||||||
| 2025-08-12 | 13F | Advisors Asset Management, Inc. | 382,751 | -7.42 | 6,997 | -11.90 | ||||
| 2025-08-14 | 13F | Twinbeech Capital Lp | 262,822 | 135.86 | 4,804 | 124.49 | ||||
| 2025-07-17 | 13F | Taylor Frigon Capital Management LLC | 151,535 | 32.16 | 2,770 | 25.79 | ||||
| 2025-07-30 | 13F | Brookstone Capital Management | 12,856 | -52.30 | 235 | -54.55 | ||||
| 2025-08-13 | 13F | Keystone Financial Group | 12,198 | 0.00 | 223 | -5.13 | ||||
| 2025-07-28 | NP | FXED - Sound Enhanced Fixed Income ETF | 76,330 | 1.12 | 1,346 | -14.77 | ||||
| 2025-07-08 | 13F | Madison Park Capital Advisors, LLC | 20,000 | 0.00 | 366 | -4.95 | ||||
| 2025-07-30 | 13F | Whittier Trust Co Of Nevada Inc | 2,723 | 2.25 | 50 | -3.92 | ||||
| 2025-08-15 | 13F | Captrust Financial Advisors | 23,539 | 7.43 | 430 | 2.38 | ||||
| 2025-08-14 | 13F | Mariner, LLC | 44,141 | 14.97 | 807 | 9.36 | ||||
| 2025-07-11 | 13F | Caldwell Securities, Inc | 4,036 | 1.00 | 74 | -3.95 | ||||
| 2025-07-16 | 13F | ORG Partners LLC | 11,756 | 0.00 | 216 | -4.02 | ||||
| 2025-07-24 | 13F | IFP Advisors, Inc | 9,216 | -4.24 | 168 | -8.70 | ||||
| 2025-08-14 | 13F | Oxford Asset Management Llp | 30,338 | 555 | ||||||
| 2025-07-10 | 13F | Kozak & Associates, Inc. | 2,877 | 2.24 | 53 | 10.42 | ||||
| 2025-08-14 | 13F | Modern Wealth Management, LLC | 13,724 | -5.64 | 251 | -10.39 | ||||
| 2025-08-12 | 13F | Deutsche Bank Ag\ | 3,249 | 2.62 | 59 | -1.67 | ||||
| 2025-08-01 | 13F | Bessemer Group Inc | 0 | -100.00 | 0 | |||||
| 2025-08-14 | 13F | Stifel Financial Corp | 569,202 | 18.86 | 10,405 | 13.11 | ||||
| 2025-07-22 | 13F | Accel Wealth Management | 21,956 | 5.35 | 401 | 0.25 | ||||
| 2025-08-04 | 13F | Creekmur Asset Management LLC | 1 | 0.00 | 0 | |||||
| 2025-07-11 | 13F | Farther Finance Advisors, LLC | 4,420 | 2.98 | 81 | -1.23 | ||||
| 2025-08-15 | 13F | Tower Research Capital LLC (TRC) | 197 | -95.60 | 4 | -96.47 | ||||
| 2025-08-14 | 13F | Cubist Systematic Strategies, LLC | 447,641 | 32.84 | 8,183 | 26.40 | ||||
| 2025-08-12 | 13F | Jpmorgan Chase & Co | 526,369 | -22.69 | 9,622 | -26.43 | ||||
| 2025-04-21 | 13F | Nelson, Van Denburg & Campbell Wealth Management Group, LLC | 0 | -100.00 | 0 | |||||
| 2025-08-14 | 13F | Hrt Financial Lp | 558,010 | 100.86 | 10 | 100.00 | ||||
| 2025-08-14 | 13F | Van Eck Associates Corp | 3,618,427 | 7.58 | 66 | 3.13 | ||||
| 2025-08-12 | 13F | MAI Capital Management | 5,024 | -13.60 | 92 | -18.02 | ||||
| 2025-08-14 | 13F | Susquehanna International Group, Llp | Put | 195,800 | -20.31 | 3,579 | -24.16 | |||
| 2025-08-14 | 13F | Susquehanna International Group, Llp | 11,831 | -47.60 | 216 | -50.12 | ||||
| 2025-08-05 | 13F | Huntington National Bank | 6,799 | 0.00 | 124 | -4.62 | ||||
| 2025-08-14 | 13F | Susquehanna International Group, Llp | Call | 221,800 | -12.30 | 4,055 | -16.55 | |||
| 2025-08-07 | 13F | Kestra Private Wealth Services, Llc | 103,832 | 14.26 | 1,898 | 8.77 | ||||
| 2025-08-14 | 13F | Peak6 Llc | Put | 20,000 | 366 | |||||
| 2025-08-11 | 13F | Principal Securities, Inc. | 10,951 | 1.64 | 200 | -7.41 | ||||
| 2025-08-14 | 13F | Peak6 Llc | 81 | 1 | ||||||
| 2025-07-14 | 13F | Armstrong Advisory Group, Inc | 2,816 | -48.39 | 51 | -53.21 | ||||
| 2025-08-11 | 13F | United Capital Financial Advisers, Llc | 14,679 | 268 | ||||||
| 2025-08-13 | 13F | Russell Investments Group, Ltd. | 520 | 0.00 | 10 | 0.00 | ||||
| 2025-08-14 | 13F | Ameriprise Financial Inc | 327,023 | -0.84 | 5,978 | -5.61 | ||||
| 2025-08-14 | 13F/A | Skopos Labs, Inc. | 1,199 | 22 | ||||||
| 2025-07-22 | 13F | Iron Horse Wealth Management, LLC | 153 | 2.00 | 3 | 0.00 | ||||
| 2025-06-27 | NP | LBO - WHITEWOLF Publicly Listed Private Equity ETF | 22,854 | 14.28 | 409 | -3.08 | ||||
| 2025-07-18 | 13F | Naples Global Advisors, Llc | 69,924 | 9.13 | 1,278 | 3.90 | ||||
| 2025-07-29 | 13F | First National Bank of Mount Dora, Trust Investment Services | 29,246 | 0.00 | 535 | -4.81 | ||||
| 2025-08-14 | 13F | State Street Corp | 168,362 | 243.97 | 3,078 | 227.34 | ||||
| 2025-07-09 | 13F | Bank of New Hampshire | 600 | 11 | ||||||
| 2025-08-14 | 13F | Jane Street Group, Llc | Put | 12,900 | 236 | |||||
| 2025-04-30 | 13F | Alps Advisors Inc | 0 | -100.00 | 0 | -100.00 | ||||
| 2025-08-14 | 13F | Jane Street Group, Llc | 67,341 | 1,231 | ||||||
| 2025-07-30 | 13F | Studio Investment Management Llc | 0 | -100.00 | 0 | |||||
| 2025-08-13 | 13F | Twin Peaks Wealth Advisors, LLC | 451 | 9 | ||||||
| 2025-04-17 | 13F | Janney Montgomery Scott LLC | 0 | -100.00 | 0 | |||||
| 2025-08-06 | 13F | First Horizon Advisors, Inc. | 2,566 | 47 | ||||||
| 2025-05-07 | 13F/A | Horizon Financial Services, Llc | 0 | -100.00 | 0 | -100.00 | ||||
| 2025-07-16 | 13F | Essex Financial Services, Inc. | 61,141 | 0.76 | 1,118 | -4.12 | ||||
| 2025-08-12 | 13F | Left Brain Wealth Management, LLC | 284,068 | 1.86 | 5,193 | -3.08 | ||||
| 2025-08-11 | 13F | Core Wealth Partners LLC | 24,153 | 0.00 | 442 | -4.75 | ||||
| 2025-04-17 | 13F | Grimes & Company, Inc. | 0 | -100.00 | 0 | -100.00 | ||||
| 2025-08-05 | 13F | Carolinas Wealth Consulting Llc | 0 | -100.00 | 0 | -100.00 | ||||
| 2025-08-07 | 13F | 1620 Investment Advisors, Inc. | 31,345 | -0.41 | 573 | -5.30 | ||||
| 2025-08-13 | 13F | Centiva Capital, LP | 0 | -100.00 | 0 | |||||
| 2025-05-14 | 13F | Quest Investment Management Llc | 0 | -100.00 | 0 | |||||
| 2025-07-29 | 13F | International Assets Investment Management, Llc | 19,455 | -7.50 | 356 | -12.13 | ||||
| 2025-08-18 | 13F | Geneos Wealth Management Inc. | 6,475 | 30.68 | 118 | 24.21 | ||||
| 2025-07-09 | 13F | Gilman Hill Asset Management, LLC | 570,379 | 0.30 | 10,427 | -4.56 | ||||
| 2025-07-15 | 13F | Graypoint LLC | 169,462 | 2.33 | 3,098 | -2.64 | ||||
| 2025-07-29 | 13F | Chicago Partners Investment Group LLC | 18,772 | 20.88 | 366 | 36.19 | ||||
| 2025-08-11 | 13F | Anfield Capital Management, LLC | 14,748 | 0.00 | 270 | -4.95 | ||||
| 2025-07-28 | 13F | Bayforest Capital Ltd | 5,289 | 97 | ||||||
| 2025-08-12 | 13F | Aigen Investment Management, Lp | 23,367 | 427 | ||||||
| 2025-07-21 | 13F | Ameritas Advisory Services, LLC | 100 | 2 | ||||||
| 2025-07-23 | 13F | Prime Capital Investment Advisors, LLC | 23,881 | -23.67 | 437 | -27.33 | ||||
| 2025-08-14 | 13F | Mercer Global Advisors Inc /adv | 19,297 | 11.76 | 353 | 6.34 | ||||
| 2025-08-14 | 13F | Group One Trading, L.p. | 56,817 | 2,969.53 | 1,039 | 2,865.71 | ||||
| 2025-08-11 | 13F | Sharpepoint Llc | 86,457 | 14.22 | 1,580 | 15.08 | ||||
| 2025-08-12 | 13F | Archer Investment Corp | 2,331 | 0.13 | 43 | -4.55 | ||||
| 2025-05-06 | 13F | Old Port Advisors | 0 | -100.00 | 0 | |||||
| 2025-08-14 | 13F | Nebula Research & Development LLC | 0 | -100.00 | 0 | |||||
| 2025-08-14 | 13F | Group One Trading, L.p. | Put | 81,600 | -13.19 | 1,492 | -17.40 | |||
| 2025-08-14 | 13F | Group One Trading, L.p. | Call | 160,700 | 6.92 | 2,938 | 1.73 | |||
| 2025-08-14 | 13F | Raymond James Financial Inc | 633,741 | -1.63 | 11,585 | -6.39 | ||||
| 2025-08-06 | 13F | Golden State Wealth Management, LLC | 75,538 | -27.01 | 1,381 | -30.55 | ||||
| 2025-08-13 | 13F | Alerus Financial Na | 517 | 9 | ||||||
| 2025-08-14 | 13F | Napa Wealth Management | 109,030 | -11.80 | 1,993 | -16.05 | ||||
| 2025-07-31 | 13F | Sumitomo Mitsui Trust Holdings, Inc. | 621,724 | 24.42 | 11,365 | 18.40 | ||||
| 2025-08-15 | 13F | Great West Life Assurance Co /can/ | 155,832 | 2.94 | 3 | 0.00 | ||||
| 2025-07-01 | 13F | Confluence Investment Management Llc | 383,778 | 0.30 | 7,015 | -4.56 | ||||
| 2025-08-12 | 13F | Franklin Resources Inc | 843,114 | 41.64 | 15,412 | 34.79 | ||||
| 2025-08-14 | 13F | Creegan & Nassoura Financial Group, LLC | 80,170 | 0.00 | 1,466 | -4.87 | ||||
| 2025-07-10 | 13F | Fulton Bank, N.a. | 12,817 | 0.00 | 234 | -4.88 | ||||
| 2025-07-15 | 13F | North Star Investment Management Corp. | 50,110 | -6.52 | 916 | -10.98 | ||||
| 2025-08-25 | NP | SSCDX - Sit Small Cap Dividend Growth Fund - Class I | 7,725 | 0.00 | 141 | -4.73 | ||||
| 2025-07-23 | NP | FAAAX - Franklin K2 Alternative Strategies Fund Class A | Short | -729 | -13 | |||||
| 2025-06-30 | NP | PSP - Invesco Global Listed Private Equity ETF This fund is a listed as child fund of Invesco Ltd. and if that institution has disclosed ownership in this security, then these positions will not be double counted when calculating total shares and total value | 64,404 | -16.01 | 1,153 | -28.93 | ||||
| 2025-04-30 | 13F | Synergy Investment Management, LLC | 0 | -100.00 | 0 | |||||
| 2025-07-31 | 13F | MQS Management LLC | 31,240 | 571 | ||||||
| 2025-08-11 | 13F | Inspire Advisors, LLC | 18,253 | -12.79 | 334 | -17.16 | ||||
| 2025-07-24 | 13F | Ronald Blue Trust, Inc. | 4,000 | 0.00 | 73 | -3.95 | ||||
| 2025-05-14 | 13F | Van Hulzen Asset Management, LLC | 0 | -100.00 | 0 | |||||
| 2025-08-14 | 13F | Federation des caisses Desjardins du Quebec | 13,775 | 0.00 | 252 | -4.92 | ||||
| 2025-08-13 | 13F | Continuum Advisory, LLC | 0 | -100.00 | 0 | |||||
| 2025-04-28 | 13F | Latitude Advisors, LLC | 0 | -100.00 | 0 | |||||
| 2025-08-11 | 13F | Delta Asset Management Llc/tn | 2,251 | -0.44 | 41 | -4.65 | ||||
| 2025-08-14 | 13F | Toroso Investments, LLC | 77,178 | -2.85 | 1,411 | -7.60 | ||||
| 2025-05-15 | 13F | Quarry LP | 0 | -100.00 | 0 | |||||
| 2025-08-06 | 13F | AE Wealth Management LLC | 28,413 | 8.83 | 519 | 3.59 | ||||
| 2025-07-10 | 13F | Security National Bank | 4,248 | 6.12 | 78 | 1.32 | ||||
| 2025-08-14 | 13F | SummitTX Capital, L.P. | 0 | -100.00 | 0 | |||||
| 2025-08-08 | 13F | MTM Investment Management, LLC | 2,900 | 53 | ||||||
| 2025-08-14 | 13F | Balyasny Asset Management Llc | 153,113 | 2,799 | ||||||
| 2025-08-12 | 13F | Magnetar Financial LLC | 17,657 | 323 | ||||||
| 2025-08-13 | 13F | Cerity Partners LLC | 29,922 | 4.78 | 547 | -0.36 | ||||
| 2025-08-14 | 13F | Two Sigma Advisers, Lp | 2,081,600 | 3.07 | 38,052 | -1.92 | ||||
| 2025-08-14 | 13F | Schonfeld Strategic Advisors LLC | 134,533 | 2,459 | ||||||
| 2025-07-18 | 13F | Generali Investments CEE, investicni spolecnost, a.s. | 0 | -100.00 | 0 | |||||
| 2025-08-04 | 13F | Arkadios Wealth Advisors | 57,630 | 0.09 | 1,053 | -4.79 | ||||
| 2025-08-14 | 13F | Pennington Partners & Co., Llc | 96,700 | 0.00 | 1,768 | -4.85 | ||||
| 2025-08-11 | 13F | Annis Gardner Whiting Capital Advisors, LLC | 6,705 | 0.00 | 123 | -4.69 | ||||
| 2025-07-21 | 13F | Ameriflex Group, Inc. | 0 | -100.00 | 0 | |||||
| 2025-08-11 | 13F | Citigroup Inc | 0 | -100.00 | 0 | |||||
| 2025-08-05 | 13F | GHP Investment Advisors, Inc. | 1,500 | 27 | ||||||
| 2025-07-07 | 13F | Delphi Management Inc /ma/ | 76,455 | 5.35 | 1 | 0.00 | ||||
| 2025-08-12 | 13F | Proequities, Inc. | Put | 0 | 0 | |||||
| 2025-08-12 | 13F | Proequities, Inc. | Call | 0 | 0 | |||||
| 2025-08-12 | 13F | Proequities, Inc. | 0 | 0 | ||||||
| 2025-08-14 | 13F | Tudor Investment Corp Et Al | 128,987 | 61.79 | 2,358 | 53.95 | ||||
| 2025-08-14 | 13F | Tudor Investment Corp Et Al | Call | 10,200 | 186 | |||||
| 2025-05-09 | 13F | Pathway Financial Advisers, LLC | 0 | -100.00 | 0 | |||||
| 2025-07-08 | 13F/A | Salem Investment Counselors Inc | 700 | -51.59 | 13 | -55.56 | ||||
| 2025-08-11 | 13F | HHM Wealth Advisors, LLC | 1,500 | 0.00 | 27 | -3.57 | ||||
| 2025-08-05 | 13F | Access Investment Management LLC | 38,200 | 0.00 | 698 | -9.00 | ||||
| 2025-08-14 | 13F | Bnp Paribas Arbitrage, Sa | 201,867 | 28.71 | 3,690 | 22.51 | ||||
| 2025-07-21 | 13F | Mirae Asset Global Investments Co., Ltd. | 6,000 | -73.22 | 110 | -74.71 | ||||
| 2025-07-23 | 13F | Steel Peak Wealth Management LLC | 38,264 | 15.39 | 699 | 9.73 | ||||
| 2025-08-14 | 13F | Bank Of America Corp /de/ | 96,608 | -23.08 | 1,766 | -26.82 | ||||
| 2025-08-12 | 13F | Waterloo Capital, L.P. | 151,351 | -0.21 | 2,767 | -5.05 | ||||
| 2025-04-22 | 13F | Synergy Financial Management, LLC | 0 | -100.00 | 0 | -100.00 | ||||
| 2025-08-04 | 13F | Muzinich & Co., Inc. | 738,169 | 44.63 | 13,494 | 37.63 | ||||
| 2025-08-12 | 13F | Virtu Financial LLC | 0 | -100.00 | 0 | |||||
| 2025-08-15 | 13F | Caxton Associates Llp | 34,323 | 627 | ||||||
| 2025-08-12 | 13F | BlackRock, Inc. | 1,066,818 | 20.91 | 19,501 | 15.06 | ||||
| 2025-08-13 | 13F | Quantbot Technologies LP | 141,787 | 745.73 | 2,592 | 704.66 | ||||
| 2025-07-18 | 13F | Union Bancaire Privee, UBP SA | 35,781 | 5.08 | 93,884 | 14,255.20 | ||||
| 2025-08-13 | 13F | Lido Advisors, LLC | 55,958 | -8.67 | 1,023 | -13.10 | ||||
| 2025-07-17 | 13F | HB Wealth Management, LLC | 0 | -100.00 | 0 | |||||
| 2025-07-31 | 13F | CNB Bank | 1,848 | 34 | ||||||
| 2025-08-14 | 13F | Millennium Management Llc | 2,909,160 | 648.94 | 53,179 | 612.76 | ||||
| 2025-07-29 | 13F | Tradewinds Capital Management, LLC | 3,728 | 2.22 | 68 | -2.86 | ||||
| 2025-08-12 | 13F | Steward Partners Investment Advisory, Llc | 112,158 | -3.74 | 2,050 | -8.40 | ||||
| 2025-08-12 | 13F | J.w. Cole Advisors, Inc. | 59,061 | 15.36 | 1,080 | 9.77 | ||||
| 2025-08-14 | 13F | Millennium Management Llc | Call | 20,000 | 0.00 | 366 | -4.95 | |||
| 2025-08-13 | 13F | Natixis | 117,971 | 26.35 | 2,157 | 20.65 | ||||
| 2025-04-17 | 13F | Good Life Advisors, LLC | 0 | -100.00 | 0 | -100.00 | ||||
| 2025-08-12 | 13F | Founders Financial Alliance, LLC | 0 | -100.00 | 0 | |||||
| 2025-08-06 | 13F | Commonwealth Equity Services, Llc | 287,158 | 4.64 | 5 | 0.00 | ||||
| 2025-07-22 | 13F | Chung Wu Investment Group, LLC | 15,178 | 0.00 | 277 | -4.81 | ||||
| 2025-08-12 | 13F | CIBC Private Wealth Group, LLC | 111,276 | -2.39 | 2,034 | 9.89 | ||||
| 2025-07-31 | 13F | Caitong International Asset Management Co., Ltd | 0 | -100.00 | 0 | |||||
| 2025-08-14 | 13F | Dark Forest Capital Management Lp | 27,059 | -12.01 | 495 | -16.27 | ||||
| 2025-05-08 | 13F | Gsa Capital Partners Llp | 0 | -100.00 | 0 | |||||
| 2025-07-16 | 13F | Dakota Wealth Management | 37,985 | 1.60 | 694 | -3.34 | ||||
| 2025-07-21 | 13F | Abundance Wealth Counselors | 58,923 | 1.32 | 1 | 0.00 | ||||
| 2025-08-14 | 13F | Wiley Bros.-aintree Capital, Llc | 29,858 | -2.54 | 546 | -5.71 | ||||
| 2025-08-08 | 13F | Larson Financial Group LLC | 0 | -100.00 | 0 | |||||
| 2025-08-14 | 13F | Sciencast Management LP | 15,442 | 282 | ||||||
| 2025-07-25 | 13F | Cwm, Llc | 1,381 | 79.58 | 0 | |||||
| 2025-08-13 | 13F | Lansforsakringar Fondforvaltning AB (publ) | 0 | -100.00 | 0 | |||||
| 2025-08-13 | 13F | Baird Financial Group, Inc. | 0 | -100.00 | 0 | |||||
| 2025-08-13 | 13F | Jones Financial Companies Lllp | 7,215 | 45.88 | 131 | 36.84 | ||||
| 2025-08-07 | 13F | Allworth Financial LP | 5,972 | 426.17 | 109 | 445.00 | ||||
| 2025-08-11 | 13F | Nations Financial Group Inc, /ia/ /adv | 94,063 | 1.18 | 1,719 | -3.70 | ||||
| 2025-08-01 | 13F | Envestnet Asset Management Inc | 41,824 | -49.30 | 765 | -51.77 | ||||
| 2025-08-14 | 13F | Brevan Howard Capital Management LP | 73,910 | 1,351 | ||||||
| 2025-07-29 | 13F | Stephens Inc /ar/ | 12,453 | 0.00 | 228 | -5.02 | ||||
| 2025-08-08 | 13F | Advisors Capital Management, LLC | 754,521 | -25.53 | 13,793 | -29.14 | ||||
| 2025-08-14 | 13F | Jane Street Group, Llc | Call | 0 | -100.00 | 0 | ||||
| 2025-08-04 | 13F | Bristlecone Advisors, LLC | 0 | -100.00 | 0 | |||||
| 2025-08-14 | 13F | SWAN Capital LLC | 253 | 5 | ||||||
| 2025-08-14 | 13F | GWM Advisors LLC | 16,875 | 16.69 | 308 | 11.19 | ||||
| 2025-08-15 | 13F | Equitable Holdings, Inc. | 21,878 | -6.74 | 400 | -11.33 | ||||
| 2025-07-16 | 13F | Eagle Global Advisors Llc | 26,125 | -32.50 | 478 | -35.80 | ||||
| 2025-08-04 | 13F | Spire Wealth Management | 1,361 | 0.29 | 25 | -7.69 | ||||
| 2025-07-18 | 13F | Truist Financial Corp | 30,415 | -5.65 | 550 | -11.31 | ||||
| 2025-08-13 | 13F | Global Endowment Management, LP | 20,000 | 0.00 | 366 | -4.95 | ||||
| 2025-08-07 | 13F | Connor, Clark & Lunn Investment Management Ltd. | 218,061 | -40.96 | 3,986 | -43.82 | ||||
| 2025-08-12 | 13F | Pathstone Holdings, LLC | 18,911 | 0.17 | 346 | -4.70 | ||||
| 2025-08-14 | 13F | Financial Advisory Service, Inc. | 186,543 | -0.83 | 3,410 | -5.62 | ||||
| 2025-08-13 | 13F | Marshall Wace, Llp | 0 | -100.00 | 0 | |||||
| 2025-08-14 | 13F | Mml Investors Services, Llc | 20,925 | 0.13 | 0 | |||||
| 2025-08-11 | 13F | VSM Wealth Advisory, LLC | 300 | 0.00 | 5 | 0.00 | ||||
| 2025-08-14 | 13F | Axa S.a. | 12,110 | 0.00 | 221 | -4.74 | ||||
| 2025-08-15 | 13F | Morgan Stanley | 1,429,585 | -9.20 | 26,133 | -13.60 | ||||
| 2025-07-28 | NP | PEX - ProShares Global Listed Private Equity ETF | 32,491 | 7.26 | 573 | -9.64 | ||||
| 2025-08-13 | 13F | Estabrook Capital Management | 1,961 | 2.24 | 36 | -2.78 | ||||
| 2025-07-28 | 13F | Naviter Wealth, LLC | 203,691 | 10.43 | 3,723 | 4.81 | ||||
| 2025-08-13 | 13F | Mount Yale Investment Advisors, LLC | 167,190 | 8.67 | 3,056 | 3.42 | ||||
| 2025-08-14 | 13F | IHT Wealth Management, LLC | 80,797 | 15.97 | 1,477 | 10.31 | ||||
| 2025-05-05 | 13F | Lindbrook Capital, Llc | 0 | -100.00 | 0 | |||||
| 2025-08-12 | 13F | SRS Capital Advisors, Inc. | 1,682 | -75.68 | 31 | -77.27 | ||||
| 2025-08-14 | 13F | Verition Fund Management LLC | 77,234 | 80.03 | 1,412 | 71.24 | ||||
| 2025-07-16 | 13F | Brown, Lisle/cummings, Inc. | 3,811 | 0.00 | 70 | -5.48 | ||||
| 2025-08-14 | 13F | Sunbelt Securities, Inc. | 13,538 | -0.07 | 272 | 4.23 | ||||
| 2025-08-13 | 13F | Baker Avenue Asset Management, LP | 173,508 | 4.59 | 3,172 | -0.47 | ||||
| 2025-08-14 | 13F | D. E. Shaw & Co., Inc. | 342,857 | 21.02 | 6,267 | 15.16 | ||||
| 2025-08-13 | 13F | Luminist Capital LLC | 25 | 0 | ||||||
| 2025-08-14 | 13F | Kovitz Investment Group Partners, LLC | 31,775 | 12.09 | 581 | 6.62 | ||||
| 2025-07-15 | 13F | Colonial River Wealth Management, LLC | 16,232 | -5.50 | 304 | -7.60 | ||||
| 2025-08-14 | 13F | Snowden Capital Advisors LLC | 14,012 | -2.10 | 256 | -6.57 | ||||
| 2025-05-15 | 13F | Evergreen Capital Management Llc | 0 | -100.00 | 0 | |||||
| 2025-07-29 | 13F | Balboa Wealth Partners | 29,949 | 5.27 | 547 | 0.18 | ||||
| 2025-08-05 | 13F | Bank of New York Mellon Corp | 113,312 | 1.89 | 2,071 | -3.04 | ||||
| 2025-08-07 | 13F | Campbell & CO Investment Adviser LLC | 168,436 | 665.13 | 3,079 | 629.62 | ||||
| 2025-08-05 | 13F | Bryce Point Capital, LLC | 36,842 | 673 | ||||||
| 2025-08-12 | 13F | LPL Financial LLC | 1,296,534 | 14.70 | 23,701 | 9.15 | ||||
| 2025-08-14 | 13F | Point72 Hong Kong Ltd | 0 | -100.00 | 0 | |||||
| 2025-08-12 | 13F | Global Retirement Partners, LLC | 23,516 | -54.20 | 430 | -58.39 | ||||
| 2025-05-14 | 13F | Caitlin John, LLC | 0 | -100.00 | 0 | |||||
| 2025-08-14 | 13F/A | Rockefeller Capital Management L.P. | 143,346 | 0.49 | 2,620 | -4.38 | ||||
| 2025-08-11 | 13F | HighTower Advisors, LLC | 72,694 | -4.95 | 1,329 | -9.60 | ||||
| 2025-08-08 | 13F | Wall Street Access Asset Management, LLC | 12,864 | 0.11 | 235 | -4.47 | ||||
| 2025-08-15 | 13F | Prevail Innovative Wealth Advisors, Llc | 88,148 | 1,611 | ||||||
| 2025-07-16 | 13F | PFS Partners, LLC | 413 | 0.00 | 8 | 0.00 | ||||
| 2025-07-08 | 13F | Parallel Advisors, LLC | 14,730 | -0.20 | 269 | -4.95 | ||||
| 2025-08-13 | 13F | Virtus Investment Advisers, Inc. | 47,438 | 9.49 | 867 | 4.21 | ||||
| 2025-08-28 | NP | AFPAX - AmericaFirst Income Fund Class A | 12,436 | -33.25 | 227 | -36.41 | ||||
| 2025-08-14 | 13F | Ancora Advisors, LLC | 1,250 | 0.00 | 23 | -8.33 | ||||
| 2025-08-14 | 13F | UBS Group AG | 1,153,006 | 42.16 | 21,077 | 35.28 | ||||
| 2025-08-08 | 13F | Cetera Investment Advisers | 192,823 | 0.90 | 3,525 | -3.98 | ||||
| 2025-08-14 | 13F | LM Advisors LLC | 0 | -100.00 | 0 | |||||
| 2025-07-23 | 13F | Tectonic Advisors Llc | 621,562 | 16.88 | 11,362 | 11.23 | ||||
| 2025-07-30 | 13F | Bleakley Financial Group, LLC | 0 | -100.00 | 0 | |||||
| 2025-07-31 | 13F | Kathleen S. Wright Associates Inc. | 1,580 | 0.00 | 29 | -6.67 | ||||
| 2025-08-13 | 13F | Prossimo Advisors, LLC | 13,089 | -25.03 | 0 | |||||
| 2025-05-23 | NP | GOP - Unusual Whales Subversive Republican Trading ETF | 4,015 | 20.53 | 77 | 16.67 | ||||
| 2025-07-16 | 13F | Diversified Enterprises, LLC | 10,312 | 0.00 | 189 | -5.05 | ||||
| 2025-08-15 | 13F | WFA of San Diego, LLC | 3,000 | 55 | ||||||
| 2025-05-15 | 13F | Talon Private Wealth, LLC | 0 | -100.00 | 0 | -100.00 | ||||
| 2025-05-15 | 13F | Occudo Quantitative Strategies Lp | 0 | -100.00 | 0 | |||||
| 2025-08-12 | 13F | FourThought Financial Partners, LLC | 12,840 | -12.62 | 235 | -17.02 | ||||
| 2025-08-13 | 13F | Brown Advisory Inc | 16,919 | 0.00 | 309 | -4.92 | ||||
| 2025-08-14 | 13F | Bramshill Investments, LLC | 38,019 | -0.67 | 695 | -5.58 | ||||
| 2025-07-14 | 13F | Sowell Financial Services LLC | 16,113 | -1.23 | 295 | -6.07 | ||||
| 2025-07-16 | 13F | Signaturefd, Llc | 5,411 | -17.46 | 99 | -21.60 | ||||
| 2025-08-21 | NP | LEOIX - Lazard Enhanced Opportunities Portfolio Institutional Shares | Short | -149 | -45.62 | -3 | -60.00 | |||
| 2025-07-21 | 13F | West Financial Advisors, LLC | 52 | 1.96 | 1 | |||||
| 2025-08-14 | 13F | Qube Research & Technologies Ltd | 580,414 | 425.62 | 10,610 | 400.19 | ||||
| 2025-07-24 | 13F | JNBA Financial Advisors | 329 | 0.00 | 6 | 0.00 | ||||
| 2025-05-15 | 13F | Crestline Management, LP | 0 | -100.00 | 0 | |||||
| 2025-07-24 | 13F | CWM Advisors, LLC | 25,816 | 21.86 | 472 | 16.01 | ||||
| 2025-08-13 | 13F | Northwestern Mutual Wealth Management Co | 4,780 | 81.82 | 87 | 74.00 | ||||
| 2025-07-29 | NP | EBI - Longview Advantage ETF | 4,500 | 0.00 | 79 | -15.96 | ||||
| 2025-08-12 | 13F | DnB Asset Management AS | 114,192 | 0.00 | 2,087 | -4.83 | ||||
| 2025-07-31 | 13F | Oppenheimer & Co Inc | 21,280 | 5.25 | 389 | 0.00 | ||||
| 2025-08-13 | 13F | Northern Trust Corp | 123,352 | 1,098.17 | 2,255 | 1,044.16 | ||||
| 2025-08-05 | 13F | Simplex Trading, Llc | 17,596 | -75.85 | 0 | -100.00 | ||||
| 2025-07-15 | 13F | BigSur Wealth Management LLC | 38,500 | -2.53 | 704 | -7.26 | ||||
| 2025-08-05 | 13F | Simplex Trading, Llc | Call | 25,600 | 72.97 | 0 | ||||
| 2025-08-05 | 13F | Simplex Trading, Llc | Put | 19,600 | -50.51 | 0 | ||||
| 2025-08-05 | 13F | Sigma Planning Corp | 49,791 | 6.37 | 910 | 1.22 | ||||
| 2025-05-30 | NP | ERNZ - TrueShares Active Yield ETF | 8,710 | 76.00 | 167 | 68.69 | ||||
| 2025-07-22 | 13F | Valley National Advisers Inc | 656 | 0.00 | 0 | |||||
| 2025-05-14 | 13F | Boston Private Wealth Llc | 0 | -100.00 | 0 | -100.00 | ||||
| 2025-07-31 | 13F | Nisa Investment Advisors, Llc | 174 | -98.15 | 3 | -98.33 | ||||
| 2025-05-15 | 13F | D. E. Shaw & Co., Inc. | Call | 0 | -100.00 | 0 | -100.00 | |||
| 2025-05-05 | 13F | Transce3nd, LLC | 0 | -100.00 | 0 | |||||
| 2025-08-14 | 13F | CoreCap Advisors, LLC | 31 | 0.00 | 1 | |||||
| 2025-07-15 | 13F | West Oak Capital, LLC | 500 | 0.00 | 0 | |||||
| 2025-08-13 | 13F | ExodusPoint Capital Management, LP | 25,800 | 0 | ||||||
| 2025-08-14 | 13F | Ares Management Llc | 201,606 | 0.00 | 3,685 | -4.83 | ||||
| 2025-08-01 | 13F | Chilton Capital Management Llc | 7,000 | 0.00 | 128 | -5.22 | ||||
| 2025-07-25 | 13F | Allspring Global Investments Holdings, LLC | 13,100 | 0.00 | 239 | -4.78 | ||||
| 2025-05-15 | 13F | PharVision Advisers, LLC | 0 | -100.00 | 0 | |||||
| 2025-08-14 | 13F | Comerica Bank | 5,681 | -20.66 | 104 | -24.82 | ||||
| 2025-09-04 | 13F/A | Advisor Group Holdings, Inc. | 120,828 | -2.17 | 2,209 | -6.87 | ||||
| 2025-07-30 | 13F | Cullen/frost Bankers, Inc. | 0 | -100.00 | 0 | -100.00 | ||||
| 2025-05-15 | 13F | Gwn Securities Inc. | 0 | -100.00 | 0 | -100.00 | ||||
| 2025-08-04 | 13F | Roble, Belko & Company, Inc | 55 | 1.85 | 0 | |||||
| 2025-07-29 | 13F | Stratos Wealth Partners, LTD. | 12,937 | 0.94 | 236 | -4.07 | ||||
| 2025-08-12 | 13F | Wealthbridge Capital Management, Llc | 12,000 | 0.00 | 219 | -4.78 | ||||
| 2025-06-25 | NP | VPC - Virtus Private Credit Strategy ETF | 39,577 | -19.25 | 708 | -31.66 | ||||
| 2025-08-05 | 13F | Prosperity Consulting Group, LLC | 0 | -100.00 | 0 | |||||
| 2025-07-09 | 13F | Triumph Capital Management | 0 | -100.00 | 0 | |||||
| 2025-07-07 | 13F | Nova Wealth Management, Inc. | 2,523 | 0.00 | 46 | -4.17 | ||||
| 2025-08-11 | 13F | Hexagon Capital Partners LLC | 0 | -100.00 | 0 | |||||
| 2025-08-14 | 13F | Royal Bank Of Canada | 788,373 | -1.95 | 14,411 | -6.70 | ||||
| 2025-08-07 | 13F | Cascade Financial Partners, LLC | 15,293 | 0.00 | 280 | -4.78 | ||||
| 2025-08-21 | NP | BIZD - VanEck Vectors BDC Income ETF | 3,293,998 | 2.50 | 60,214 | -2.46 | ||||
| 2025-08-11 | 13F | Rothschild Investment Llc | 100 | 0.00 | 2 | 0.00 | ||||
| 2025-05-14 | 13F | Credit Agricole S A | 527,236 | 46.22 | 10,128 | 39.83 | ||||
| 2025-08-08 | 13F | Accredited Investors Inc. | 23,000 | 0.00 | 420 | -4.76 | ||||
| 2025-08-05 | 13F | Strategic Financial Concepts, LLC | 14,150 | 0.00 | 259 | -4.80 | ||||
| 2025-08-08 | 13F | Cedar Wealth Management, LLC | 9,759 | 0.00 | 178 | -4.81 | ||||
| 2025-08-14 | 13F | Diversify Advisory Services, LLC | 22,345 | 430 | ||||||
| 2025-07-07 | 13F | Thurston, Springer, Miller, Herd & Titak, Inc. | 700 | 0.00 | 13 | -7.69 | ||||
| 2025-05-15 | 13F | Parvin Asset Management, LLC | 0 | -100.00 | 0 | |||||
| 2025-07-17 | 13F | Alpine Bank Wealth Management | 1,829 | 33 | ||||||
| 2025-07-11 | 13F | Kingstone Capital Partners Texas, LLC | 28,419,870 | 522 | ||||||
| 2025-08-13 | 13F | Summit Financial, LLC | 40,817 | 746 | ||||||
| 2025-07-28 | 13F | Axxcess Wealth Management, Llc | 16,232 | -5.50 | 297 | -10.03 | ||||
| 2025-07-14 | 13F | Painted Porch Advisors LLC | 1,541 | 0.20 | 28 | -3.45 | ||||
| 2025-08-13 | 13F | Allie Family Office LLC | 15,000 | 0.00 | 274 | -4.86 | ||||
| 2025-07-24 | 13F | Blair William & Co/il | 203,205 | 1.60 | 3,715 | -3.33 | ||||
| 2025-07-16 | 13F | Register Financial Advisors LLC | 15,317 | 0.14 | 280 | -4.78 | ||||
| 2025-07-29 | NP | ISMD - Inspire Small/Mid Cap Impact ETF | 18,930 | 0.27 | 334 | -15.48 | ||||
| 2025-07-30 | 13F | D.a. Davidson & Co. | 295,514 | 3.35 | 5,402 | -1.64 | ||||
| 2025-08-18 | 13F | N.E.W. Advisory Services LLC | 0 | -100.00 | 0 | |||||
| 2025-06-27 | NP | PASIX - PACE Alternative Strategies Investments Class A | Short | -271 | -5 | |||||
| 2025-08-18 | 13F | Wolverine Trading, Llc | Call | 34,600 | 8.12 | 628 | 1.79 | |||
| 2025-08-18 | 13F | Wolverine Trading, Llc | Put | 43,600 | -56.83 | 791 | -59.38 | |||
| 2025-08-14 | 13F | Fieldview Capital Management, LLC | 0 | -100.00 | 0 | |||||
| 2025-08-14 | 13F | Aquatic Capital Management LLC | 5,416 | -94.05 | 99 | -94.33 | ||||
| 2025-08-18 | 13F | Wolverine Trading, Llc | 12,725 | -69.99 | 231 | -71.81 | ||||
| 2025-07-30 | NP | HYIN - WisdomTree Alternative Income Fund N/A | 93,068 | 12.37 | 1,641 | -5.26 | ||||
| 2025-07-22 | 13F | Autumn Glory Partners, LLC | 29,000 | 0.00 | 530 | -4.85 | ||||
| 2025-08-12 | 13F | Summit Global Investments | 24,200 | 0.00 | 0 | |||||
| 2025-08-18 | 13F | Hollencrest Capital Management | 2,522 | 0.00 | 46 | -4.17 | ||||
| 2025-07-22 | NP | GINN - Goldman Sachs Innovate Equity ETF | 10,017 | -8.42 | 177 | -22.81 | ||||
| 2025-08-14 | 13F | Voloridge Investment Management, Llc | 630,644 | 43.65 | 11,528 | 36.70 | ||||
| 2025-07-25 | 13F | Apollon Wealth Management, LLC | 19,103 | -4.83 | 349 | -9.35 | ||||
| 2025-04-25 | 13F | Albion Financial Group /ut | 0 | -100.00 | 0 | |||||
| 2025-07-10 | 13F | Wealth Enhancement Advisory Services, Llc | 32,778 | -0.16 | 610 | -3.33 | ||||
| 2025-08-12 | 13F | Trexquant Investment LP | 0 | -100.00 | 0 | |||||
| 2025-08-14 | 13F | Sit Investment Associates Inc | 18,050 | 0.00 | 0 | |||||
| 2025-08-19 | 13F | Advisory Services Network, LLC | 29,551 | -40.49 | 554 | -41.87 | ||||
| 2025-07-01 | 13F | Harbor Investment Advisory, Llc | 0 | -100.00 | 0 | |||||
| 2025-07-25 | 13F | Atria Wealth Solutions, Inc. | 22,726 | -90.47 | 415 | -90.94 | ||||
| 2025-05-16 | 13F | Coppell Advisory Solutions LLC | 0 | -100.00 | 0 | -100.00 | ||||
| 2025-07-25 | 13F | Community Bank, N.A. | 625 | 0.00 | 11 | -8.33 | ||||
| 2025-05-14 | 13F | Virtus ETF Advisers LLC | 0 | -100.00 | 0 | -100.00 | ||||
| 2025-08-14 | 13F | Glen Eagle Advisors, LLC | 100 | 0.00 | 2 | 0.00 | ||||
| 2025-08-20 | NP | LSPAX - LoCorr Spectrum Income Fund Class A | 34,818 | 0.00 | 636 | -4.79 | ||||
| 2025-08-27 | 13F/A | Squarepoint Ops LLC | 49,192 | -5.98 | 899 | -10.55 | ||||
| 2025-08-13 | 13F | Beacon Pointe Advisors, LLC | 31,717 | 125.76 | 580 | 115.24 | ||||
| 2025-08-11 | 13F | TD Waterhouse Canada Inc. | 200 | 0.00 | 4 | 0.00 | ||||
| 2025-08-14 | 13F | Wells Fargo & Company/mn | 753,654 | -0.61 | 13,777 | -5.42 | ||||
| 2025-08-12 | 13F | Change Path, LLC | 13,950 | -0.01 | 255 | -4.85 | ||||
| 2025-04-29 | 13F | Raleigh Capital Management Inc. | 0 | -100.00 | 0 | |||||
| 2025-07-18 | 13F | SOA Wealth Advisors, LLC. | 0 | -100.00 | 0 | |||||
| 2025-08-13 | 13F | Legacy Capital Wealth Partners, LLC | 82,035 | -3.03 | 1,500 | -7.75 | ||||
| 2025-05-08 | 13F | XTX Topco Ltd | 0 | -100.00 | 0 | -100.00 | ||||
| 2025-07-14 | 13F | Border to Coast Pensions Partnership Ltd | 375,000 | 7.14 | 7 | 0.00 | ||||
| 2025-08-11 | 13F | Universal- Beteiligungs- und Servicegesellschaft mbH | 11,548 | 2.65 | 211 | -2.31 | ||||
| 2025-07-16 | 13F | Crowley Wealth Management, Inc. | 900 | 0.00 | 16 | -5.88 | ||||
| 2025-07-21 | 13F | TFG Advisers LLC | 65,371 | 8.61 | 1,195 | 3.29 | ||||
| 2025-07-30 | 13F | LGT Financial Advisors LLC | 0 | -100.00 | 0 | -100.00 | ||||
| 2025-08-08 | 13F | Pnc Financial Services Group, Inc. | 268,698 | -1.94 | 4,912 | -6.69 |