Statistik Asas
| Pemilik Institusi | 181 total, 175 long only, 0 short only, 6 long/short - change of 7.74% MRQ |
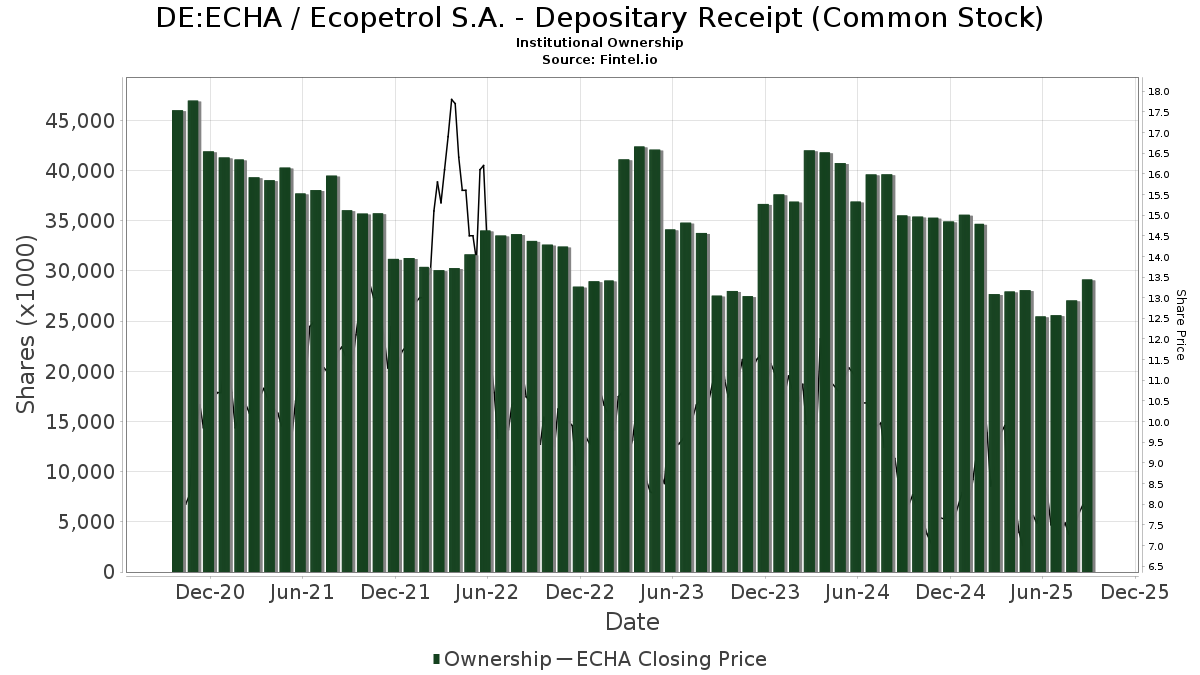
| Harga Saham | 7.68 |
| Purata Peruntukan Portfolio | 0.1433 % - change of -5.55% MRQ |
| Saham Institusi (Panjang) | 29,152,457 (ex 13D/G) - change of 3.15MM shares 12.13% MRQ |
| Nilai Institusi (Panjang) | $ 251,669 USD ($1000) |
Pemilikan Institusi dan Pemegang Saham
Ecopetrol S.A. - Depositary Receipt (Common Stock) (DE:ECHA) telah 181 pemilik institusi dan pemegang saham yang telah memfailkan borang 13D/G atau 13F dengan Suruhanjaya Bursa Sekuriti (SEC). Institusi ini memegang sejumlah 29,152,457 saham. Pemegang saham terbesar termasuk Oaktree Capital Management Lp, Vanguard Group Inc, Russell Investments Group, Ltd., BlackRock, Inc., MIRAE ASSET GLOBAL ETFS HOLDINGS Ltd., Charles Schwab Investment Management Inc, FNDE - Schwab Fundamental Emerging Markets Large Company Index ETF, VEIEX - Vanguard Emerging Markets Stock Index Fund Investor Shares, ILF - iShares Latin America 40 ETF, and Candriam Luxembourg S.C.A. .
Ecopetrol S.A. - Depositary Receipt (Common Stock) (DB:ECHA) struktur pemilikan institusi menunjukkan kedudukan semasa dalam syarikat mengikut institusi dan dana serta perubahan terkini dalam saiz kedudukan. Pemegang saham utama boleh termasuk pelabur individu, dana amanah, dana lindung nilai atau institusi. Jadual 13D menunjukkan bahawa pelabur memegang (atau menahan) lebih daripada 5% syarikat dan berhasrat (atau berniat) untuk secara aktif meneruskan perubahan dalam strategi perniagaan. Jadual 13G menunjukkan pelaburan pasif melebihi 5%.
The share price as of September 5, 2025 is 7.68 / share. Previously, on September 9, 2024, the share price was 8.40 / share. This represents a decline of 8.57% over that period.
Skor Sentimen Dana
Skor Sentimen Dana (Skor Pengumpulan Pemilikan fka) mencari saham yang paling banyak dibeli oleh dana. Ia adalah hasil daripada model kuantitatif pelbagai faktor yang canggih yang mengenal pasti syarikat dengan tahap pengumpulan institusi tertinggi. Model pemarkahan ini menggunakan gabungan jumlah kenaikan dalam pemilik yang didedahkan, perubahan dalam peruntukan portfolio dalam pemilik tersebut dan metrik lain. Nombornya berjulat dari 0 hingga 100, dengan nombor yang lebih tinggi menunjukkan tahap pengumpulan yang lebih tinggi kepada rakannya, dan 50 adalah nombor purata.
Kekerapan Kemas Kini: Harian
Lihat Peneroka Pemilikan yang menyediakan senarai syarikat yang mempunyai kedudukan tertinggi.
Pemfailan 13F dan NPORT
Butiran mengenai pemfailan 13F adalah percuma. Perincian mengenai pemfailan NP memerlukan keahlian premium. Baris hijau menunjukkan kedudukan baharu. Baris merah menunjukkan kedudukan tertutup. Klik pautan ikon untuk melihat sejarah transaksi penuh.
Naik Taraf
untuk membuka data premium dan mengeksport ke Excel ![]() .
.
| Tarikh Fail | Sumber | Pelabur | Jenis | Purata Harga (Ang) |
Saham | ΔSaham (%) |
Nilai Dilaporkan ($1000) |
Δ Nilai (%) |
Peruntukan Port (%) |
|
|---|---|---|---|---|---|---|---|---|---|---|
| 2025-08-26 | NP | RPAR - RPAR Risk Parity ETF | 27,176 | -6.27 | 241 | -20.53 | ||||
| 2025-05-15 | 13F | Bayesian Capital Management, LP | 0 | -100.00 | 0 | |||||
| 2025-08-14 | 13F | Hrt Financial Lp | 40,610 | 0 | ||||||
| 2025-08-08 | 13F | Candriam Luxembourg S.C.A. | 841,000 | 7,443 | ||||||
| 2025-08-07 | 13F | Rathbone Brothers plc | 17,575 | -2.23 | 156 | -17.11 | ||||
| 2025-04-23 | 13F | Legacy Advisors, LLC | 0 | -100.00 | 0 | |||||
| 2025-07-14 | 13F | Sowell Financial Services LLC | 11,468 | 3.29 | 101 | -12.17 | ||||
| 2025-08-13 | 13F | Walleye Trading LLC | Call | 228,400 | 2,021 | |||||
| 2025-08-18 | 13F/A | National Bank Of Canada /fi/ | 145 | -99.25 | 1 | -99.50 | ||||
| 2025-08-13 | 13F | Walleye Trading LLC | Put | 20,900 | -83.50 | 185 | -86.08 | |||
| 2025-08-05 | 13F | Simplex Trading, Llc | Put | 47,700 | -51.67 | 0 | -100.00 | |||
| 2025-08-05 | 13F | Simplex Trading, Llc | Call | 97,900 | 21.46 | 1 | ||||
| 2025-08-12 | 13F | O'shaughnessy Asset Management, Llc | 50,363 | 397.90 | 446 | 323.81 | ||||
| 2025-08-29 | NP | LIVR - Intelligent Livermore ETF | 18,077 | 160 | ||||||
| 2025-08-14 | 13F | D. E. Shaw & Co., Inc. | 208,080 | 1,842 | ||||||
| 2025-08-13 | 13F | Walleye Trading LLC | 0 | -100.00 | 0 | -100.00 | ||||
| 2025-08-13 | 13F | Virtus Investment Advisers, Inc. | 17,435 | -11.14 | 154 | -24.51 | ||||
| 2025-08-11 | 13F | Truffle Hound Capital, LLC | 550,000 | 83.33 | 4,868 | 55.40 | ||||
| 2025-07-30 | 13F | DekaBank Deutsche Girozentrale | 20,000 | 0.00 | 0 | |||||
| 2025-08-14 | 13F | Militia Capital Partners, LP | 556,200 | 16.07 | 4,922 | -1.60 | ||||
| 2025-05-09 | 13F | R Squared Ltd | 0 | -100.00 | 0 | |||||
| 2025-08-14 | 13F | Susquehanna International Group, Llp | 34,063 | -85.16 | 301 | -87.44 | ||||
| 2025-08-14 | 13F | Susquehanna International Group, Llp | Call | 163,900 | -16.63 | 1,451 | -29.34 | |||
| 2025-08-14 | 13F | Susquehanna International Group, Llp | Put | 51,700 | -91.38 | 458 | -92.70 | |||
| 2025-07-28 | NP | AVEEX - Avantis Emerging Markets Equity Fund Institutional Class This fund is a listed as child fund of American Century Companies Inc and if that institution has disclosed ownership in this security, then these positions will not be double counted when calculating total shares and total value | 3,730 | 0.00 | 32 | -13.89 | ||||
| 2025-08-11 | 13F | Empirical Finance, LLC | 300,866 | 73.90 | 2,663 | 47.40 | ||||
| 2025-08-13 | 13F | Manning & Napier Advisors Llc | 213,858 | 34.97 | 1,893 | 14.39 | ||||
| 2025-08-14 | 13F | Group One Trading, L.p. | 52,176 | 25.29 | 462 | 6.22 | ||||
| 2025-08-14 | 13F | Group One Trading, L.p. | Put | 58,500 | 5.60 | 518 | -10.55 | |||
| 2025-08-12 | 13F | Legal & General Group Plc | 149,470 | 0.00 | 1,322 | -15.36 | ||||
| 2025-08-14 | 13F | Group One Trading, L.p. | Call | 102,300 | 80.11 | 905 | 52.87 | |||
| 2025-03-17 | NP | ABLD - Donoghue Forlines Yield Enhanced Real Asset ETF | 11,031 | -49.51 | 102 | -39.29 | ||||
| 2025-08-14 | 13F | Gotham Asset Management, LLC | 10,000 | 0.00 | 88 | -15.38 | ||||
| 2025-05-06 | 13F | Cetera Investment Advisers | 0 | -100.00 | 0 | |||||
| 2025-08-13 | 13F | Russell Investments Group, Ltd. | 1,903,377 | -6.86 | 16,845 | -21.05 | ||||
| 2025-08-12 | 13F | CIBC Private Wealth Group, LLC | 251 | 2 | ||||||
| 2025-08-28 | NP | Principal Diversified Select Real Asset Fund | 389 | 0.00 | 3 | -25.00 | ||||
| 2025-06-18 | NP | RAZAX - Multi-Asset Growth Strategy Fund Class A | 13,826 | 0.00 | 112 | -12.50 | ||||
| 2025-06-18 | NP | RMYAX - Multi-Strategy Income Fund Class A | 4,238 | 0.00 | 34 | -12.82 | ||||
| 2025-08-06 | 13F | Metis Global Partners, LLC | 11,773 | 104 | ||||||
| 2025-08-26 | NP | GLBIX - Leuthold Global Fund Institutional Class | 6,745 | 60 | ||||||
| 2025-07-21 | 13F | Ping Capital Management, Inc. | 39,000 | 8.33 | 345 | -8.00 | ||||
| 2025-08-25 | NP | MAINSTAY VP FUNDS TRUST - MainStay VP Emerging Markets Equity Portfolio Initial Class | 120,000 | 42.86 | 1,062 | 16.45 | ||||
| 2025-08-26 | NP | EQ ADVISORS TRUST - EQ/International Core Managed Volatility Portfolio Class IB | 60,372 | -9.14 | 534 | -22.94 | ||||
| 2025-08-13 | 13F | First Trust Advisors Lp | 0 | -100.00 | 0 | |||||
| 2025-08-15 | 13F | Earnest Partners Llc | 443,848 | -3.13 | 3,928 | -17.88 | ||||
| 2025-08-14 | 13F | Balyasny Asset Management Llc | 0 | -100.00 | 0 | |||||
| 2025-09-04 | 13F/A | Advisor Group Holdings, Inc. | 146,072 | 24.36 | 1,293 | 5.38 | ||||
| 2025-08-06 | 13F | Pekin Hardy Strauss, Inc. | 124,573 | 3.75 | 1,102 | -12.05 | ||||
| 2025-08-01 | 13F | Y-Intercept (Hong Kong) Ltd | 252,697 | 2,236 | ||||||
| 2025-08-14 | 13F | Axa S.a. | 30,620 | 271 | ||||||
| 2025-08-11 | 13F | Principal Securities, Inc. | 0 | -100.00 | 0 | |||||
| 2025-08-14 | 13F | Wetherby Asset Management Inc | 12,769 | -12.08 | 113 | -1.74 | ||||
| 2025-08-14 | 13F | Ameriprise Financial Inc | 0 | -100.00 | 0 | |||||
| 2025-08-15 | 13F | Tower Research Capital LLC (TRC) | 2,933 | -45.89 | 26 | -55.36 | ||||
| 2025-08-14 | 13F | Citadel Advisors Llc | 173,200 | -37.57 | 1,533 | -47.10 | ||||
| 2025-06-20 | NP | ABLG - TrimTabs All Cap International Free-Cash-Flow ETF | 0 | -100.00 | 0 | -100.00 | ||||
| 2025-08-14 | 13F | Citadel Advisors Llc | Put | 23,400 | -29.52 | 207 | -40.17 | |||
| 2025-08-14 | 13F | Stifel Financial Corp | 29,586 | 0.33 | 262 | -14.98 | ||||
| 2025-08-26 | NP | ILF - iShares Latin America 40 ETF | 864,786 | 9.35 | 7,653 | -7.30 | ||||
| 2025-08-14 | 13F | Citadel Advisors Llc | Call | 118,600 | 1.37 | 1,050 | -14.09 | |||
| 2025-07-11 | 13F | Farther Finance Advisors, LLC | 1,625 | -5.08 | 14 | -22.22 | ||||
| 2025-08-13 | 13F | Leuthold Group, Llc | 26,071 | 231 | ||||||
| 2025-08-13 | 13F | Northwestern Mutual Wealth Management Co | 0 | -100.00 | 0 | |||||
| 2025-07-25 | NP | FNDE - Schwab Fundamental Emerging Markets Large Company Index ETF This fund is a listed as child fund of Charles Schwab Investment Management Inc and if that institution has disclosed ownership in this security, then these positions will not be double counted when calculating total shares and total value | 927,528 | 46.99 | 7,856 | 26.02 | ||||
| 2025-08-13 | 13F | Marshall Wace, Llp | 37,600 | 333 | ||||||
| 2025-04-22 | 13F | Synergy Financial Management, LLC | 0 | -100.00 | 0 | |||||
| 2025-07-14 | 13F | GAMMA Investing LLC | 20,679 | -20.81 | 183 | -32.72 | ||||
| 2025-08-12 | 13F | Global Retirement Partners, LLC | 498 | 12.42 | 4 | 33.33 | ||||
| 2025-08-13 | 13F | EverSource Wealth Advisors, LLC | 1,707 | 1,023.03 | 15 | 1,400.00 | ||||
| 2025-08-08 | 13F | Avantax Advisory Services, Inc. | 37,856 | 273.22 | 335 | 219.05 | ||||
| 2025-08-13 | 13F | Oaktree Capital Management Lp | 3,549,822 | 12.26 | 31,416 | -4.84 | ||||
| 2025-08-04 | 13F | Spire Wealth Management | 2,500 | -69.51 | 22 | -74.12 | ||||
| 2025-08-05 | 13F | GHP Investment Advisors, Inc. | 0 | -100.00 | 0 | |||||
| 2025-08-26 | NP | OEQAX - Oaktree Emerging Markets Equity Fund Class A | 207,885 | 3.48 | 1,840 | -12.30 | ||||
| 2025-07-18 | 13F | Robeco Institutional Asset Management B.V. | 99,796 | 0.00 | 883 | -15.18 | ||||
| 2025-07-21 | 13F | Patriot Financial Group Insurance Agency, LLC | 19,780 | 175 | ||||||
| 2025-08-14 | 13F | Two Sigma Investments, Lp | 222,160 | 26.24 | 1,966 | 7.02 | ||||
| 2025-08-06 | 13F | Stokes Family Office, LLC | 212,808 | 25.19 | 1,883 | 6.14 | ||||
| 2025-07-25 | NP | PRDAX - Diversified Real Asset Fund Class A | 4,662 | 48.42 | 39 | 25.81 | ||||
| 2025-08-14 | 13F | Goldman Sachs Group Inc | 612,058 | -0.41 | 5,417 | -15.59 | ||||
| 2025-05-14 | 13F | Public Employees Retirement System Of Ohio | 0 | -100.00 | 0 | |||||
| 2025-07-07 | 13F | Thurston, Springer, Miller, Herd & Titak, Inc. | 26 | 0 | ||||||
| 2025-07-24 | 13F | Us Bancorp \de\ | 2,069 | 0.00 | 18 | -14.29 | ||||
| 2025-08-14 | 13F | State Street Corp | 281,818 | 0.27 | 2,494 | -15.00 | ||||
| 2025-07-21 | 13F | Qrg Capital Management, Inc. | 0 | -100.00 | 0 | |||||
| 2025-08-12 | 13F | Proequities, Inc. | Put | 0 | 0 | |||||
| 2025-08-12 | 13F | Proequities, Inc. | Call | 0 | 0 | |||||
| 2025-08-12 | 13F | Proequities, Inc. | 0 | 0 | ||||||
| 2025-08-13 | 13F | Northern Trust Corp | 118,193 | -6.16 | 1,046 | -20.40 | ||||
| 2025-05-13 | 13F | Wealthedge Investment Advisors, Llc | 0 | -100.00 | 0 | |||||
| 2025-05-15 | 13F | D. E. Shaw & Co., Inc. | Put | 0 | -100.00 | 0 | -100.00 | |||
| 2025-08-12 | 13F | Advisors Asset Management, Inc. | 83,564 | -7.52 | 740 | -21.63 | ||||
| 2025-08-14 | 13F/A | Skopos Labs, Inc. | 36,136 | 138.76 | 320 | 101.90 | ||||
| 2025-08-11 | 13F | Citigroup Inc | 217,491 | -0.75 | 1,925 | -15.87 | ||||
| 2025-08-12 | 13F | LPL Financial LLC | 112,205 | 9.91 | 993 | -6.76 | ||||
| 2025-05-12 | 13F | Connor, Clark & Lunn Investment Management Ltd. | 0 | -100.00 | 0 | -100.00 | ||||
| 2025-07-15 | 13F | Compagnie Lombard Odier SCmA | 0 | -100.00 | 0 | -100.00 | ||||
| 2025-05-14 | 13F | FORA Capital, LLC | 0 | -100.00 | 0 | |||||
| 2025-07-28 | NP | NSI - National Security Emerging Markets Index ETF | 2,485 | 38.44 | 21 | 23.53 | ||||
| 2025-08-14 | 13F | Vident Advisory, LLC | 49,191 | -2.57 | 435 | -17.46 | ||||
| 2025-04-15 | 13F | TrimTabs Asset Management, LLC | 0 | -100.00 | 0 | |||||
| 2025-07-31 | 13F | Caitong International Asset Management Co., Ltd | 698 | 35.53 | 6 | 20.00 | ||||
| 2025-08-11 | 13F | Empowered Funds, LLC | 318,943 | 2,823 | ||||||
| 2025-07-29 | NP | SSEAX - SIIT Screened World Equity Ex-US Fund - Class A | 6,263 | 53 | ||||||
| 2025-08-20 | NP | REMG - Emerging Markets Equity Active ETF | 6,895 | 61 | ||||||
| 2025-08-13 | 13F | Fisher Asset Management, LLC | 456,819 | 3.15 | 4,043 | -12.57 | ||||
| 2025-07-16 | 13F | ORG Partners LLC | 375 | -28.98 | 3 | -40.00 | ||||
| 2025-08-14 | 13F | Verition Fund Management LLC | 309,922 | 124.49 | 2,743 | 90.28 | ||||
| 2025-08-26 | NP | UPAR - UPAR Ultra Risk Parity ETF | 4,494 | -11.20 | 40 | -25.00 | ||||
| 2025-08-15 | 13F | Great West Life Assurance Co /can/ | 6,874 | 0.00 | 0 | |||||
| 2025-08-12 | 13F | MAI Capital Management | 491 | 4 | ||||||
| 2025-08-07 | 13F | Sierra Ocean, Llc | 125 | 0.00 | 1 | 0.00 | ||||
| 2025-08-14 | 13F | Sona Asset Management (us) Llc | 200,000 | 100.00 | 1,770 | 69.54 | ||||
| 2025-07-15 | 13F | Ballentine Partners, LLC | 12,483 | -22.60 | 110 | -34.52 | ||||
| 2025-05-05 | 13F | Lindbrook Capital, Llc | 4,746 | -0.79 | 50 | 32.43 | ||||
| 2025-08-14 | 13F | UBS Group AG | 760,367 | 62.38 | 6,729 | 37.66 | ||||
| 2025-08-14 | 13F | Massar Capital Management, LP | 40,000 | 0.00 | 354 | -15.11 | ||||
| 2025-08-04 | 13F | Assetmark, Inc | 71 | 1 | ||||||
| 2025-08-14 | 13F | Aquatic Capital Management LLC | 0 | -100.00 | 0 | |||||
| 2025-06-25 | NP | VRAI - Virtus Real Asset Income ETF | 15,324 | -21.04 | 124 | -31.11 | ||||
| 2025-07-08 | 13F | Parallel Advisors, LLC | 5,440 | -3.68 | 48 | -17.24 | ||||
| 2025-08-14 | 13F | Royal Bank Of Canada | 258,225 | 12,753.41 | 2,285 | 10,780.95 | ||||
| 2025-08-14 | 13F | Barometer Capital Management Inc. | 43,400 | 45.15 | 384 | 36.65 | ||||
| 2025-08-26 | NP | IXC - iShares Global Energy ETF | 164,711 | 1.04 | 1,458 | -14.34 | ||||
| 2025-07-21 | 13F | Platinum Investment Management Ltd | 14,711 | 0.00 | 130 | -15.03 | ||||
| 2025-05-12 | 13F | Simplex Trading, Llc | 0 | -100.00 | 0 | |||||
| 2025-08-12 | 13F | Jpmorgan Chase & Co | 82,728 | -90.68 | 732 | -92.10 | ||||
| 2025-07-28 | 13F | Allianz Asset Management GmbH | 451,674 | 3,997 | ||||||
| 2025-08-14 | 13F | Wealth High Governance Capital Ltda | 186,000 | 0.00 | 1,646 | -15.20 | ||||
| 2025-05-09 | 13F | X-Square Capital, LLC | 0 | -100.00 | 0 | |||||
| 2025-08-14 | 13F | Schonfeld Strategic Advisors LLC | 181,551 | 202.85 | 1,607 | 156.96 | ||||
| 2025-08-14 | 13F | Mariner, LLC | 33,356 | -2.79 | 295 | -17.60 | ||||
| 2025-08-01 | 13F | Envestnet Asset Management Inc | 10,458 | 93 | ||||||
| 2025-08-12 | 13F | XTX Topco Ltd | 0 | -100.00 | 0 | |||||
| 2025-08-14 | 13F | Integrated Wealth Concepts LLC | 31,966 | 283 | ||||||
| 2025-08-11 | 13F | EntryPoint Capital, LLC | 17,568 | 7.25 | 155 | -9.36 | ||||
| 2025-08-11 | 13F | Private Advisor Group, LLC | 25,797 | 9.49 | 228 | -6.94 | ||||
| 2025-08-13 | 13F | Capital Fund Management S.a. | 165,697 | 529.64 | 1,466 | 435.04 | ||||
| 2025-07-21 | 13F | Mirae Asset Global Investments Co., Ltd. | 4,794 | 8.27 | 42 | -6.67 | ||||
| 2025-07-30 | 13F | Blume Capital Management, Inc. | 0 | -100.00 | 0 | |||||
| 2025-08-14 | 13F | Two Sigma Securities, Llc | 29,342 | 50.42 | 260 | 27.59 | ||||
| 2025-06-30 | NP | VIHAX - Vanguard International High Dividend Yield Index Fund Admiral Shares | 161,378 | 11.70 | 1,309 | -2.39 | ||||
| 2025-07-16 | 13F | Signaturefd, Llc | 7,452 | -32.96 | 66 | -43.97 | ||||
| 2025-08-14 | 13F | Graham Capital Management, L.P. | 0 | -100.00 | 0 | |||||
| 2025-08-13 | 13F | Oaktree Fund Advisors, LLC | 207,885 | 3.48 | 1,840 | -12.30 | ||||
| 2025-05-29 | NP | Jnl Series Trust - Jnl/jpmorgan Global Allocation Fund (a) | 14,515 | 0.00 | 152 | 32.46 | ||||
| 2025-06-18 | NP | REMSX - Emerging Markets Fund Class S | 90,383 | 48.38 | 733 | 29.73 | ||||
| 2025-06-30 | NP | VT - Vanguard Total World Stock Index Fund ETF Shares | 108,766 | 30.91 | 882 | 14.40 | ||||
| 2025-08-14 | 13F | Smartleaf Asset Management LLC | 2,759 | 25 | ||||||
| 2025-08-12 | 13F | Charles Schwab Investment Management Inc | 1,180,354 | 16.00 | 10,446 | -1.67 | ||||
| 2025-08-14 | 13F | Bnp Paribas Arbitrage, Sa | 47,918 | -16.54 | 424 | -29.22 | ||||
| 2025-08-13 | 13F | Schroder Investment Management Group | 100,294 | 888 | ||||||
| 2025-08-13 | 13F | Jump Financial, LLC | 36,614 | 324 | ||||||
| 2025-08-13 | 13F | Invesco Ltd. | 74,265 | -9.38 | 657 | -23.16 | ||||
| 2025-06-18 | NP | RTNAX - Tax-Managed International Equity Fund Class A | 263,904 | 97.85 | 2,140 | 73.00 | ||||
| 2025-07-29 | 13F | Straight Path Wealth Management | 0 | -100.00 | 0 | |||||
| 2025-07-25 | 13F | JustInvest LLC | 18,628 | 2.61 | 165 | -13.23 | ||||
| 2025-08-12 | 13F | BlackRock, Inc. | 1,316,556 | -0.89 | 11,652 | -15.99 | ||||
| 2025-08-14 | 13F | Millennium Management Llc | 261,079 | 325.96 | 2,311 | 261.50 | ||||
| 2025-08-14 | 13F | BW Gestao de Investimentos Ltda. | 114,000 | 0.00 | 1,009 | -15.29 | ||||
| 2025-07-31 | 13F | MQS Management LLC | 15,401 | 136 | ||||||
| 2025-08-12 | 13F | Aigen Investment Management, Lp | 13,444 | 119 | ||||||
| 2025-07-30 | NP | APIE - ActivePassive International Equity ETF | 91,498 | 775 | ||||||
| 2025-08-19 | 13F | State of Wyoming | 0 | -100.00 | 0 | |||||
| 2025-08-14 | 13F | Bridgefront Capital, LLC | 18,058 | 160 | ||||||
| 2025-05-14 | 13F | Virtus ETF Advisers LLC | 0 | -100.00 | 0 | |||||
| 2025-08-08 | 13F | JBF Capital, Inc. | 20,000 | 0.00 | 177 | -14.90 | ||||
| 2025-08-08 | 13F | Larson Financial Group LLC | 466 | 27.32 | 4 | 33.33 | ||||
| 2025-07-11 | 13F | Kingstone Capital Partners Texas, LLC | 285,360 | 3 | ||||||
| 2025-05-22 | NP | FTRI - First Trust Indxx Global Natural Resources Income ETF This fund is a listed as child fund of First Trust Advisors Lp and if that institution has disclosed ownership in this security, then these positions will not be double counted when calculating total shares and total value | 400,293 | -28.25 | 4,179 | -5.41 | ||||
| 2025-07-14 | 13F | Ridgewood Investments LLC | 2,479 | 0.00 | 22 | -16.00 | ||||
| 2025-08-14 | 13F | Jane Street Group, Llc | Put | 28,000 | -60.89 | 248 | -66.93 | |||
| 2025-08-14 | 13F | Jane Street Group, Llc | Call | 31,600 | -1.86 | 280 | -16.96 | |||
| 2025-08-14 | 13F | Lazard Asset Management Llc | 256,505 | 39.46 | 2 | 100.00 | ||||
| 2025-08-14 | 13F | Jane Street Group, Llc | 200,125 | 465.34 | 1,771 | 379.95 | ||||
| 2025-08-14 | 13F | Brevan Howard Capital Management LP | 150,000 | 1,330 | ||||||
| 2025-08-06 | 13F | Fox Run Management, L.l.c. | 38,157 | 144.36 | 338 | 106.75 | ||||
| 2025-08-08 | 13F | SBI Securities Co., Ltd. | 221,044 | 1.31 | 1,956 | -14.10 | ||||
| 2025-08-13 | 13F | Arrowstreet Capital, Limited Partnership | 0 | -100.00 | 0 | |||||
| 2025-08-12 | 13F | Rhumbline Advisers | 4,385 | 19.00 | 39 | 0.00 | ||||
| 2025-08-07 | 13F | Allworth Financial LP | 1,432 | -11.99 | 13 | -20.00 | ||||
| 2025-08-13 | 13F | Quadrant Capital Group Llc | 0 | -100.00 | 0 | |||||
| 2025-07-01 | 13F | Confluence Investment Management Llc | 12,947 | -8.04 | 115 | -21.92 | ||||
| 2025-08-12 | 13F | Virtu Financial LLC | 27,935 | 0 | ||||||
| 2025-06-24 | NP | SFENX - Schwab Fundamental Emerging Markets Large Company Index Fund Institutional Shares | 133,853 | 104.63 | 1,086 | 78.75 | ||||
| 2025-08-14 | 13F | Engineers Gate Manager LP | 91,266 | -9.45 | 808 | -23.29 | ||||
| 2025-07-28 | NP | AVEM - Avantis Emerging Markets Equity ETF This fund is a listed as child fund of American Century Companies Inc and if that institution has disclosed ownership in this security, then these positions will not be double counted when calculating total shares and total value | 422,044 | 20.98 | 3,575 | 3.71 | ||||
| 2025-08-14 | 13F | Glenorchy Capital Ltd | 59,391 | 6.04 | 526 | -10.10 | ||||
| 2025-07-18 | 13F | B.O.S.S. Retirement Advisors, LLC | 0 | -100.00 | 0 | |||||
| 2025-06-27 | NP | SDIV - Global X SuperDividend ETF This fund is a listed as child fund of Mirae Asset Global Investments Co., Ltd. and if that institution has disclosed ownership in this security, then these positions will not be double counted when calculating total shares and total value | 773,445 | 3.13 | 6,273 | -9.87 | ||||
| 2025-08-28 | NP | GNR - SPDR(R) S&P(R) Global Natural Resources ETF | 170,004 | 1.73 | 1,505 | -13.76 | ||||
| 2025-08-13 | 13F | Quantbot Technologies LP | 44,580 | -68.09 | 395 | -72.98 | ||||
| 2025-07-29 | NP | WEUSX - Siit World Equity Ex-us Fund - Class A | 215,298 | 1,824 | ||||||
| 2025-07-09 | 13F | St. Louis Financial Planners Asset Management, LLC | 17,508 | -3.89 | 155 | -18.95 | ||||
| 2025-08-12 | 13F | American Century Companies Inc | 448,060 | 22.17 | 3,965 | 3.58 | ||||
| 2025-06-30 | NP | VEU - Vanguard FTSE All-World ex-US Index Fund ETF Shares | 216,425 | 11.27 | 1,755 | -2.72 | ||||
| 2025-07-31 | 13F | Nisa Investment Advisors, Llc | 500 | 0.00 | 4 | -20.00 | ||||
| 2025-08-05 | 13F | Strategic Financial Concepts, LLC | 16,400 | 0.00 | 146 | 0.00 | ||||
| 2025-08-11 | 13F | Anfield Capital Management, LLC | 8,988 | 0.00 | 80 | -15.05 | ||||
| 2025-04-15 | 13F | SG Americas Securities, LLC | 0 | -100.00 | 0 | |||||
| 2025-08-08 | 13F | Creative Planning | 41,975 | -29.19 | 371 | -39.97 | ||||
| 2025-07-25 | 13F | LRI Investments, LLC | 64 | 0.00 | 1 | |||||
| 2025-07-31 | 13F | Brinker Capital Investments, LLC | 0 | -100.00 | 0 | -100.00 | ||||
| 2025-08-14 | 13F | Hilltop Holdings Inc. | 51,186 | 0.13 | 453 | -15.20 | ||||
| 2025-08-11 | 13F | Vanguard Group Inc | 3,206,459 | -0.25 | 28,377 | -15.44 | ||||
| 2025-05-15 | 13F | Qube Research & Technologies Ltd | 0 | -100.00 | 0 | |||||
| 2025-05-15 | 13F | Two Sigma Advisers, Lp | 0 | -100.00 | 0 | |||||
| 2025-03-28 | NP | GAOAX - JPMorgan Global Allocation Fund Class A | 45,289 | 70.59 | 420 | 36.36 | ||||
| 2025-08-15 | 13F | Morgan Stanley | 413,805 | 34.87 | 3,662 | 14.33 | ||||
| 2025-07-30 | NP | ORR - Militia Long/Short Equity ETF | 285,146 | 158.92 | 2,415 | 121.97 | ||||
| 2025-06-23 | NP | UBPIX - Ultralatin America Profund Investor Class | 4,897 | -5.19 | 40 | 0.00 | ||||
| 2025-08-14 | 13F | Wells Fargo & Company/mn | 53,742 | 162.71 | 476 | 123.00 | ||||
| 2025-08-07 | 13F | Parkside Financial Bank & Trust | 136 | 1 | ||||||
| 2025-08-27 | 13F/A | Squarepoint Ops LLC | 21,108 | 26.66 | 187 | 7.51 | ||||
| 2025-07-29 | NP | SEPIX - Energy & Basic Materials Portfolio Energy & Basic Materials Class I | 1,516 | -2.13 | 13 | -20.00 | ||||
| 2025-07-22 | 13F | Sage Investment Counsel LLC | 11,500 | 0.00 | 102 | -15.83 | ||||
| 2025-08-08 | 13F | Pnc Financial Services Group, Inc. | 11 | 0.00 | 0 | |||||
| 2025-07-24 | 13F | IFP Advisors, Inc | 0 | -100.00 | 0 | |||||
| 2025-03-28 | NP | EMRSX - JPMorgan Emerging Markets Research Enhanced Equity Fund Class R6 | 208,881 | -0.41 | 1,938 | 20.00 | ||||
| 2025-08-14 | 13F | Raymond James Financial Inc | 2,648 | 23 | ||||||
| 2025-06-30 | NP | VEIEX - Vanguard Emerging Markets Stock Index Fund Investor Shares | 898,446 | 1.85 | 7,286 | -10.99 | ||||
| 2025-08-14 | 13F | Banco BTG Pactual S.A. | 26,740 | 237 | ||||||
| 2025-08-14 | 13F | Bank Of America Corp /de/ | 257,265 | 14.83 | 2,277 | -2.65 | ||||
| 2025-08-04 | 13F | Hantz Financial Services, Inc. | 28,152 | 1,482.46 | 0 | |||||
| 2025-08-14 | 13F | MIRAE ASSET GLOBAL ETFS HOLDINGS Ltd. | 1,190,268 | 9.42 | 10,534 | -7.25 | ||||
| 2025-08-12 | 13F | Atlas Capital Advisors Llc | 12,417 | 477.00 | 110 | 395.45 | ||||
| 2025-07-24 | 13F | Ronald Blue Trust, Inc. | 1,889 | 120.16 | 17 | 100.00 | ||||
| 2025-08-12 | 13F | SRS Capital Advisors, Inc. | 1,500 | 0.00 | 16 | 6.67 | ||||
| 2025-07-28 | NP | AVXC - Avantis Emerging Markets ex-China Equity ETF | 5,164 | 218.18 | 44 | 168.75 | ||||
| 2025-05-09 | 13F | Headlands Technologies LLC | 0 | -100.00 | 0 | |||||
| 2025-08-14 | 13F | Kerrisdale Advisers, LLC | 67,555 | 0.00 | 598 | -15.32 | ||||
| 2025-08-06 | 13F | Prospera Financial Services Inc | 0 | -100.00 | 0 | -100.00 | ||||
| 2025-08-14 | 13F | Toroso Investments, LLC | 31,670 | -7.00 | 280 | -21.13 | ||||
| 2025-08-13 | 13F | Amundi | 0 | -100.00 | 0 |