Statistik Asas
| Pemilik Institusi | 192 total, 184 long only, 4 short only, 4 long/short - change of 0.00% MRQ |
| Purata Peruntukan Portfolio | 0.2461 % - change of 1.53% MRQ |
| Saham Diterbitkan | shares (source: Capital IQ) |
| Saham Institusi (Panjang) | 32,770,410 (ex 13D/G) - change of 13.82MM shares 72.91% MRQ |
| Nilai Institusi (Panjang) | $ 437,686 USD ($1000) |
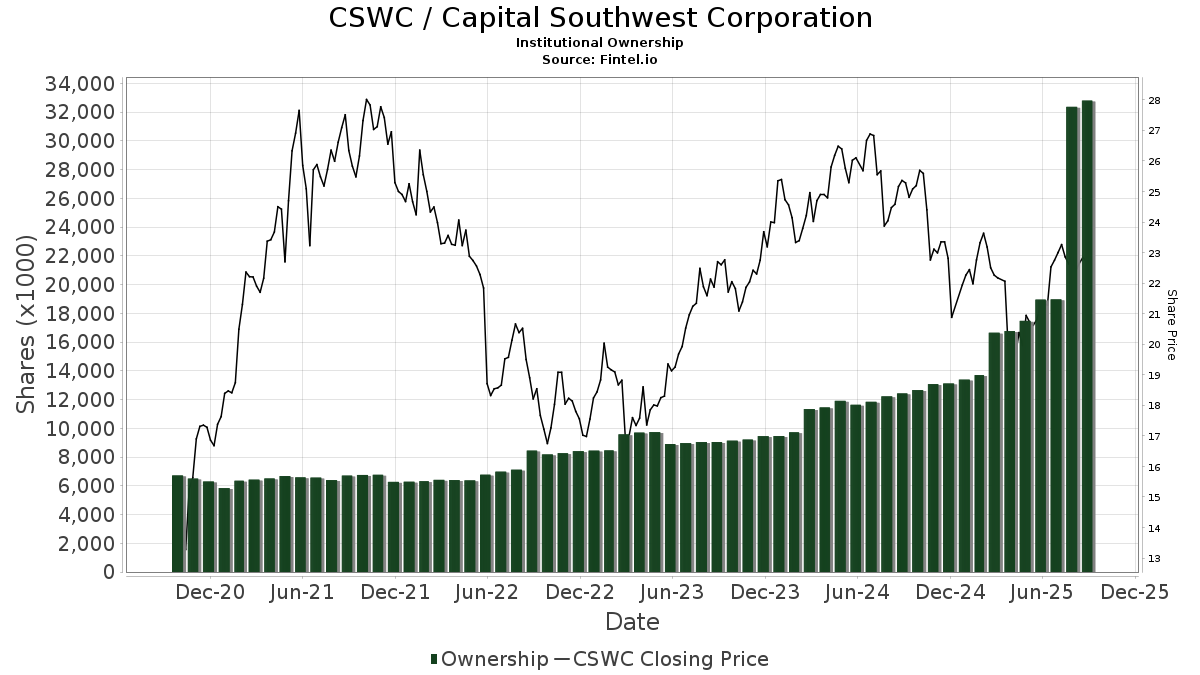
Pemilikan Institusi dan Pemegang Saham
Capital Southwest Corporation (US:CSWC) telah 192 pemilik institusi dan pemegang saham yang telah memfailkan borang 13D/G atau 13F dengan Suruhanjaya Bursa Sekuriti (SEC). Institusi ini memegang sejumlah 32,772,785 saham. Pemegang saham terbesar termasuk Kingstone Capital Partners Texas, LLC, Sanders Morris Harris Llc, Van Eck Associates Corp, BIZD - VanEck Vectors BDC Income ETF, Two Sigma Advisers, Lp, UBS Group AG, Two Sigma Investments, Lp, Sound Income Strategies, LLC, Balyasny Asset Management Llc, and Millennium Management Llc .
Capital Southwest Corporation (NasdaqGS:CSWC) struktur pemilikan institusi menunjukkan kedudukan semasa dalam syarikat mengikut institusi dan dana serta perubahan terkini dalam saiz kedudukan. Pemegang saham utama boleh termasuk pelabur individu, dana amanah, dana lindung nilai atau institusi. Jadual 13D menunjukkan bahawa pelabur memegang (atau menahan) lebih daripada 5% syarikat dan berhasrat (atau berniat) untuk secara aktif meneruskan perubahan dalam strategi perniagaan. Jadual 13G menunjukkan pelaburan pasif melebihi 5%.
The share price as of September 5, 2025 is 22.96 / share. Previously, on September 6, 2024, the share price was 24.99 / share. This represents a decline of 8.12% over that period.
Skor Sentimen Dana
Skor Sentimen Dana (Skor Pengumpulan Pemilikan fka) mencari saham yang paling banyak dibeli oleh dana. Ia adalah hasil daripada model kuantitatif pelbagai faktor yang canggih yang mengenal pasti syarikat dengan tahap pengumpulan institusi tertinggi. Model pemarkahan ini menggunakan gabungan jumlah kenaikan dalam pemilik yang didedahkan, perubahan dalam peruntukan portfolio dalam pemilik tersebut dan metrik lain. Nombornya berjulat dari 0 hingga 100, dengan nombor yang lebih tinggi menunjukkan tahap pengumpulan yang lebih tinggi kepada rakannya, dan 50 adalah nombor purata.
Kekerapan Kemas Kini: Harian
Lihat Peneroka Pemilikan yang menyediakan senarai syarikat yang mempunyai kedudukan tertinggi.
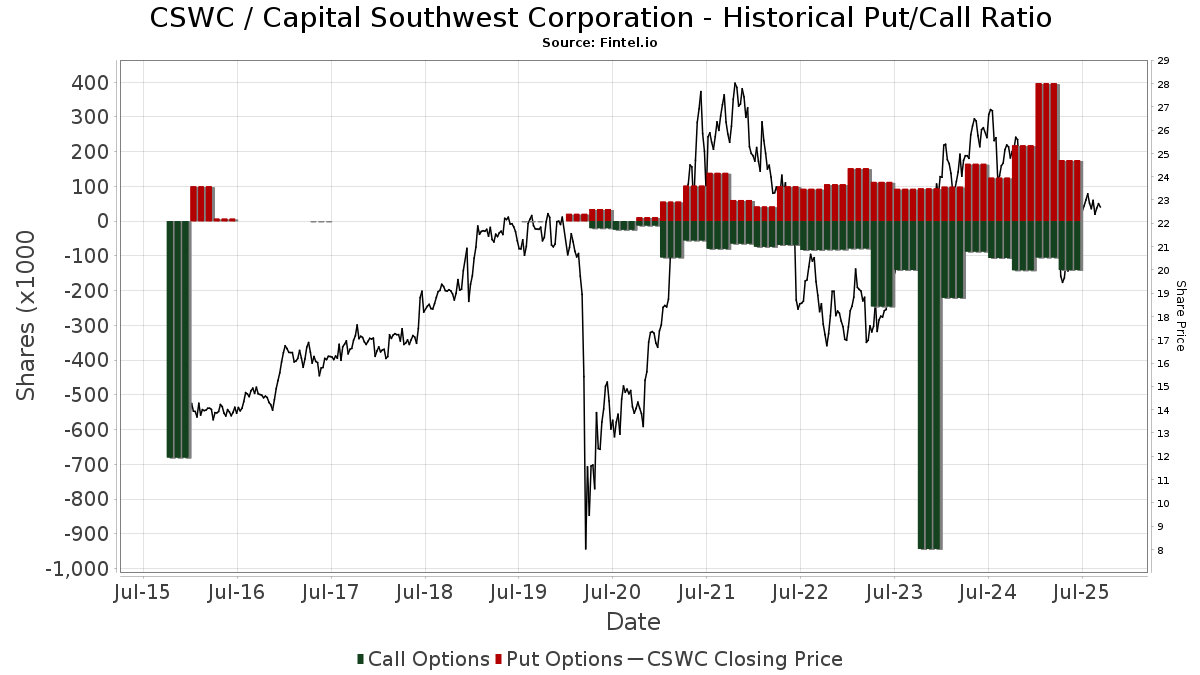
Nisbah Put/Call Institusi
Selain melaporkan isu ekuiti dan hutang standard, institusi yang mempunyai lebih daripada 100MM aset di bawah pengurusan juga mesti mendedahkan pegangan opsyen jual dan beli mereka. Memandangkan opsyen jual secara amnya menunjukkan sentimen negatif, dan opsyen beli menunjukkan sentimen positif, kita boleh mendapatkan gambaran keseluruhan sentimen institusi dengan merencanakan nisbah jual kepada beli. Carta di sebelah kanan memplotkan nisbah jual/beli sejarah untuk instrumen ini.
Menggunakan Nisbah Put/Callsebagai penunjuk sentimen pelabur mengatasi salah satu kekurangan utama menggunakan jumlah pemilikan institusi, iaitu sejumlah besar aset di bawah pengurusan dilaburkan secara pasif untuk menjejaki indeks. Dana yang diurus secara pasif biasanya tidak membeli opsyen, jadi penunjuk nisbah put/call mengekori rapat sentimen dana yang diurus secara aktif.
Pemfailan 13F dan NPORT
Butiran mengenai pemfailan 13F adalah percuma. Perincian mengenai pemfailan NP memerlukan keahlian premium. Baris hijau menunjukkan kedudukan baharu. Baris merah menunjukkan kedudukan tertutup. Klik pautan ikon untuk melihat sejarah transaksi penuh.
Naik Taraf
untuk membuka data premium dan mengeksport ke Excel ![]() .
.
| Tarikh Fail | Sumber | Pelabur | Jenis | Purata Harga (Ang) |
Saham | ΔSaham (%) |
Nilai Dilaporkan ($1000) |
Δ Nilai (%) |
Peruntukan Port (%) |
|
|---|---|---|---|---|---|---|---|---|---|---|
| 2025-08-27 | NP | JNL SERIES TRUST - JNL Multi-Manager Alternative Fund (A) | Short | -1,763 | -19.20 | -39 | -20.83 | |||
| 2025-08-18 | 13F | Wolverine Trading, Llc | Put | 0 | -100.00 | 0 | ||||
| 2025-08-14 | 13F | Tudor Investment Corp Et Al | 35,219 | 776 | ||||||
| 2025-08-06 | 13F | Smh Capital Advisors Inc | 45,215 | -1.67 | 997 | -2.92 | ||||
| 2025-08-14 | 13F | FJ Capital Management LLC | 35,067 | -12.51 | 773 | -13.65 | ||||
| 2025-08-06 | 13F | Rialto Wealth Management, LLC | 4,809 | 0.00 | 106 | -1.87 | ||||
| 2025-08-14 | 13F | Voloridge Investment Management, Llc | 80,641 | 22.70 | 1,777 | 21.21 | ||||
| 2025-08-12 | 13F | Advisors Asset Management, Inc. | 112,511 | -24.27 | 2,480 | -25.22 | ||||
| 2025-08-14 | 13F | Brevan Howard Capital Management LP | 54,503 | 1,201 | ||||||
| 2025-08-19 | 13F | National Asset Management, Inc. | 92,163 | 82.05 | 2,031 | 83.97 | ||||
| 2025-08-12 | 13F | Archer Investment Corp | 0 | -100.00 | 0 | |||||
| 2025-08-14 | 13F | UBS Group AG | 783,060 | 163.77 | 17,259 | 160.46 | ||||
| 2025-08-15 | 13F | Morgan Stanley | 227,396 | 42.30 | 5,012 | 40.52 | ||||
| 2025-07-14 | 13F | Ridgewood Investments LLC | 500 | 0.00 | 11 | 0.00 | ||||
| 2025-08-18 | 13F | Wolverine Trading, Llc | 0 | -100.00 | 0 | |||||
| 2025-07-24 | 13F | Grace & White Inc /ny | 174,597 | -1.13 | 3,848 | -2.36 | ||||
| 2025-08-04 | 13F | Muzinich & Co., Inc. | 225,790 | 64.37 | 4,976 | 62.30 | ||||
| 2025-08-07 | 13F | Samalin Investment Counsel, LLC | 25,864 | 7.97 | 570 | 6.74 | ||||
| 2025-08-14 | 13F | Verition Fund Management LLC | 31,500 | -6.73 | 694 | -7.84 | ||||
| 2025-06-18 | NP | Putnam ETF Trust - Putnam BDC ETF - | 267,259 | 5.63 | 5,447 | -4.37 | ||||
| 2025-07-17 | 13F | Janney Montgomery Scott LLC | 0 | -100.00 | 0 | |||||
| 2025-07-30 | 13F | Denali Advisors Llc | 113,850 | -2.19 | 2,509 | -3.43 | ||||
| 2025-08-11 | 13F | Moerus Capital Management LLC | 73,983 | 0.00 | 1,631 | -1.27 | ||||
| 2025-08-11 | 13F | Citigroup Inc | 0 | -100.00 | 0 | |||||
| 2025-08-12 | 13F | Jpmorgan Chase & Co | 8,423 | -74.44 | 186 | -74.83 | ||||
| 2025-08-08 | 13F | Pnc Financial Services Group, Inc. | 1,566 | 0.00 | 35 | 0.00 | ||||
| 2025-07-30 | 13F | Sanders Morris Harris Llc | 1,390,339 | -2.98 | 30,643 | -4.20 | ||||
| 2025-08-14 | 13F | Sunbelt Securities, Inc. | 37,229 | -5.10 | 812 | -7.20 | ||||
| 2025-07-25 | 13F | Total Clarity Wealth Management, Inc. | 0 | -100.00 | 0 | |||||
| 2025-08-14 | 13F | Harwood Advisory Group, LLC | 0 | -100.00 | 0 | |||||
| 2025-07-18 | 13F | SOA Wealth Advisors, LLC. | 0 | -100.00 | 0 | |||||
| 2025-08-13 | 13F | Beacon Pointe Advisors, LLC | 226,212 | -45.42 | 4,986 | -46.11 | ||||
| 2025-08-15 | 13F | Prevail Innovative Wealth Advisors, Llc | 56,395 | 1,243 | ||||||
| 2025-08-12 | 13F | TCTC Holdings, LLC | 2,136 | 0.00 | 47 | 0.00 | ||||
| 2025-08-14 | 13F | Sovereign's Capital Management, LLC | 77,048 | 9.49 | 1,698 | 8.15 | ||||
| 2025-04-28 | 13F | Mainstream Capital Management LLC | 0 | -100.00 | 0 | |||||
| 2025-07-28 | 13F | Melia Wealth LLC | 464,973 | 10.10 | 10,248 | 8.73 | ||||
| 2025-08-14 | 13F | GWM Advisors LLC | 639 | -96.48 | 14 | -96.54 | ||||
| 2025-07-21 | 13F | Catalina Capital Group, LLC | 0 | -100.00 | 0 | |||||
| 2025-08-14 | 13F | Punch & Associates Investment Management, Inc. | 0 | -100.00 | 0 | |||||
| 2025-04-29 | 13F | Raleigh Capital Management Inc. | 0 | -100.00 | 0 | |||||
| 2025-07-28 | 13F | Naviter Wealth, LLC | 100,105 | 22.45 | 2,206 | 17.28 | ||||
| 2025-08-13 | 13F | PharVision Advisers, LLC | 11,249 | 248 | ||||||
| 2025-08-19 | 13F | Newbridge Financial Services Group, Inc. | 3,176 | 70 | ||||||
| 2025-07-31 | 13F | Caitong International Asset Management Co., Ltd | 19 | 0 | ||||||
| 2025-07-25 | 13F | Atria Wealth Solutions, Inc. | 9,738 | 215 | ||||||
| 2025-08-08 | 13F | Creative Planning | 9,114 | 201 | ||||||
| 2025-08-14 | 13F | Goldman Sachs Group Inc | 212,781 | -17.42 | 4,690 | -18.47 | ||||
| 2025-08-13 | 13F | Virtus Investment Advisers, Inc. | 41,064 | -7.02 | 905 | -8.12 | ||||
| 2025-08-15 | 13F | Tower Research Capital LLC (TRC) | 1,877 | 13,307.14 | 41 | |||||
| 2025-07-21 | 13F | Monticello Wealth Management, Llc | 18,272 | 0.00 | 403 | -1.23 | ||||
| 2025-05-12 | 13F | Fmr Llc | 0 | -100.00 | 0 | |||||
| 2025-08-13 | 13F | Quantbot Technologies LP | 75,546 | 22.73 | 1,665 | 21.27 | ||||
| 2025-08-14 | 13F | Cubist Systematic Strategies, LLC | 107,201 | 98.47 | 2,363 | 96.02 | ||||
| 2025-08-13 | 13F | Jump Financial, LLC | 40,579 | 894 | ||||||
| 2025-08-05 | 13F | Simplex Trading, Llc | Call | 11,000 | 83.33 | 0 | ||||
| 2025-07-31 | 13F | Nisa Investment Advisors, Llc | 3,500 | 600.00 | 77 | 600.00 | ||||
| 2025-07-24 | 13F | IFP Advisors, Inc | 475 | 10 | ||||||
| 2025-08-14 | 13F | Royal Bank Of Canada | 149,055 | 115.59 | 3,285 | 112.76 | ||||
| 2025-08-05 | 13F | Simplex Trading, Llc | Put | 8,500 | -42.95 | 0 | ||||
| 2025-08-05 | 13F | Simplex Trading, Llc | 14,793 | 24.33 | 0 | |||||
| 2025-07-24 | NP | FNCMX - Fidelity Nasdaq Composite Index Fund This fund is a listed as child fund of Fmr Llc and if that institution has disclosed ownership in this security, then these positions will not be double counted when calculating total shares and total value | 11,251 | 0.00 | 234 | -10.69 | ||||
| 2025-05-15 | 13F | Wolverine Trading, Llc | Call | 0 | -100.00 | 0 | -100.00 | |||
| 2025-08-14 | 13F | Nebula Research & Development LLC | 25,907 | 571 | ||||||
| 2025-07-11 | 13F | Caldwell Securities, Inc | 41,052 | -1.62 | 905 | -2.90 | ||||
| 2025-08-08 | 13F | Geode Capital Management, Llc | 11,251 | 0.00 | 248 | -1.59 | ||||
| 2025-08-14 | 13F | Benjamin Edwards Inc | 87,765 | 3.52 | 1,934 | 2.22 | ||||
| 2025-08-13 | 13F | EverSource Wealth Advisors, LLC | 2,787 | 18.14 | 61 | 17.31 | ||||
| 2025-08-14 | 13F | Engineers Gate Manager LP | 41,379 | 111.26 | 912 | 108.47 | ||||
| 2025-05-14 | 13F | Brown Brothers Harriman & Co | 0 | -100.00 | 0 | |||||
| 2025-08-12 | 13F | Franklin Resources Inc | 290,762 | -2.63 | 6,408 | -3.86 | ||||
| 2025-04-28 | 13F | Redmont Wealth Advisors Llc | 53,623 | -19.89 | 1,197 | -18.08 | ||||
| 2025-08-25 | 13F/A | Promus Capital, LLC | 1,384 | 0.00 | 31 | 0.00 | ||||
| 2025-08-12 | 13F | Change Path, LLC | 98,874 | 7.45 | 2,179 | 6.14 | ||||
| 2025-07-25 | 13F | Cwm, Llc | 2,930 | 26.57 | 0 | |||||
| 2025-08-14 | 13F | Susquehanna International Group, Llp | 21,139 | -43.76 | 466 | -44.51 | ||||
| 2025-08-08 | 13F | Cetera Investment Advisers | 361,722 | 402.78 | 7,972 | 396.70 | ||||
| 2025-08-14 | 13F | Quantinno Capital Management LP | 10,893 | 240 | ||||||
| 2025-07-14 | 13F | AdvisorNet Financial, Inc | 300 | -50.66 | 7 | -53.85 | ||||
| 2025-08-14 | 13F | Susquehanna International Group, Llp | Call | 87,800 | 55.95 | 1,935 | 54.06 | |||
| 2025-07-23 | 13F | Columbus Macro, LLC | 290,704 | 6,407 | ||||||
| 2025-08-14 | 13F | Susquehanna International Group, Llp | Put | 63,100 | 50.96 | 1,391 | 49.14 | |||
| 2025-08-07 | 13F | Hodges Capital Management Inc. | 106,045 | 15.57 | 2,337 | 14.11 | ||||
| 2025-08-14 | 13F | Mariner, LLC | 28,314 | 43.75 | 624 | 42.14 | ||||
| 2025-07-21 | 13F | Ameriflex Group, Inc. | 0 | -100.00 | 0 | |||||
| 2025-07-15 | 13F | North Star Investment Management Corp. | 1,025 | 94.13 | 23 | 100.00 | ||||
| 2025-07-23 | 13F | Nbt Bank N A /ny | 30 | 0.00 | 1 | |||||
| 2025-07-28 | NP | PEX - ProShares Global Listed Private Equity ETF | 10,594 | 7.46 | 221 | -3.93 | ||||
| 2025-08-07 | 13F | Allworth Financial LP | 4,600 | 101 | ||||||
| 2025-08-14 | 13F | Raymond James Financial Inc | 286,597 | -4.66 | 6,317 | -5.86 | ||||
| 2025-08-14 | 13F | Jane Street Group, Llc | Call | 26,600 | 586 | |||||
| 2025-07-23 | 13F | Tectonic Advisors Llc | 521,686 | 18.44 | 11,498 | 16.95 | ||||
| 2025-08-14 | 13F | Jane Street Group, Llc | 20,497 | 102.28 | 452 | 99.56 | ||||
| 2025-07-24 | 13F | Ronald Blue Trust, Inc. | 3,148 | 6.24 | 69 | 4.55 | ||||
| 2025-08-14 | 13F | State Street Corp | 49,224 | 243.38 | 1,085 | 239.81 | ||||
| 2025-09-04 | 13F/A | Advisor Group Holdings, Inc. | 25,645 | -2.32 | 565 | -3.58 | ||||
| 2025-07-25 | NP | First Trust Specialty Finance & Financial Opportunities Fund This fund is a listed as child fund of First Trust Advisors Lp and if that institution has disclosed ownership in this security, then these positions will not be double counted when calculating total shares and total value | 71,000 | 0.00 | 1,478 | -10.59 | ||||
| 2025-07-11 | 13F | Farther Finance Advisors, LLC | 3,698 | 786.81 | 82 | 800.00 | ||||
| 2025-08-14 | 13F/A | Barclays Plc | 24,717 | -83.89 | 1 | -100.00 | ||||
| 2025-08-15 | 13F | Caxton Associates Llp | 14,257 | 0.00 | 314 | -1.26 | ||||
| 2025-07-31 | 13F | Sumitomo Mitsui Trust Holdings, Inc. | 172,597 | 28.63 | 3,804 | 27.05 | ||||
| 2025-08-11 | 13F | Nomura Asset Management Co Ltd | 2,135 | 58.50 | 47 | 56.67 | ||||
| 2025-08-14 | 13F | Point72 Hong Kong Ltd | 2,189 | 48 | ||||||
| 2025-03-28 | NP | ESCQX - Embark Small Cap Equity Fund Retirement Class | 398,887 | 0.00 | 8,979 | -6.92 | ||||
| 2025-07-17 | 13F | Sound Income Strategies, LLC | 702,201 | 13.99 | 15,477 | 12.56 | ||||
| 2025-08-14 | 13F | Wells Fargo & Company/mn | 12,200 | 54.82 | 269 | 53.14 | ||||
| 2025-07-22 | 13F | Grimes & Company, Inc. | 13,303 | -28.47 | 293 | -29.40 | ||||
| 2025-08-06 | 13F | First Horizon Advisors, Inc. | 2,628 | 1,214.00 | 58 | 1,325.00 | ||||
| 2025-08-11 | 13F | HHM Wealth Advisors, LLC | 500 | 0.00 | 11 | 0.00 | ||||
| 2025-08-14 | 13F | Vident Advisory, LLC | 19,087 | 6.06 | 421 | 4.74 | ||||
| 2025-08-13 | 13F | Townsquare Capital Llc | 0 | -100.00 | 0 | |||||
| 2025-08-14 | 13F | Point72 Asset Management, L.P. | 78,808 | 1,737 | ||||||
| 2025-08-12 | 13F | Argent Trust Co | 123,348 | 52.63 | 2,719 | 50.75 | ||||
| 2025-08-14 | 13F | Dearborn Partners Llc | 15,787 | -14.31 | 348 | -15.57 | ||||
| 2025-07-09 | 13F | Harbor Capital Advisors, Inc. | 0 | -100.00 | 0 | |||||
| 2025-07-31 | 13F | Cambridge Investment Research Advisors, Inc. | 28,528 | -12.17 | 1 | |||||
| 2025-05-13 | 13F | Quadrant Capital Group Llc | 0 | -100.00 | 0 | |||||
| 2025-08-12 | 13F | LPL Financial LLC | 205,640 | 4.03 | 4,532 | 2.72 | ||||
| 2025-08-12 | 13F | Aigen Investment Management, Lp | 11,822 | 261 | ||||||
| 2025-04-24 | 13F | Wingate Wealth Advisors, Inc. | 0 | -100.00 | 0 | |||||
| 2025-08-14 | 13F | Balyasny Asset Management Llc | 546,280 | -31.98 | 12,040 | -32.83 | ||||
| 2025-08-14 | 13F | Van Eck Associates Corp | 1,347,300 | 15.46 | 30 | 11.54 | ||||
| 2025-08-12 | 13F | Trexquant Investment LP | 46,630 | 1,028 | ||||||
| 2025-08-12 | 13F | Proequities, Inc. | Put | 0 | 0 | |||||
| 2025-08-12 | 13F | Proequities, Inc. | Call | 0 | 0 | |||||
| 2025-08-12 | 13F | Proequities, Inc. | 0 | 0 | ||||||
| 2025-07-31 | 13F | Oppenheimer & Co Inc | 0 | -100.00 | 0 | |||||
| 2025-08-12 | 13F | Legal & General Group Plc | 332,746 | 4.58 | 7,334 | 3.27 | ||||
| 2025-07-14 | 13F | U.S. Capital Wealth Advisors, LLC | 0 | -100.00 | 0 | |||||
| 2025-08-14 | 13F | Group One Trading, L.p. | 0 | -100.00 | 0 | -100.00 | ||||
| 2025-08-07 | 13F | Runnymede Capital Advisors, Inc. | 0 | -100.00 | 0 | |||||
| 2025-08-15 | 13F | Northeast Financial Consultants Inc | 0 | -100.00 | 0 | |||||
| 2025-07-18 | 13F | PFG Investments, LLC | 0 | -100.00 | 0 | |||||
| 2025-08-11 | 13F | Hexagon Capital Partners LLC | 0 | -100.00 | 0 | |||||
| 2025-07-22 | 13F | IMC-Chicago, LLC | Put | 10,100 | -15.83 | 223 | -16.85 | |||
| 2025-07-23 | 13F | Hager Investment Management Services, Llc | 500 | 0.00 | 11 | 0.00 | ||||
| 2025-08-14 | 13F | Quarry LP | 3,715 | 174.98 | 82 | 170.00 | ||||
| 2025-07-21 | 13F | DHJJ Financial Advisors, Ltd. | 5 | 0.00 | 0 | |||||
| 2025-08-14 | 13F | Bnp Paribas Arbitrage, Sa | 0 | -100.00 | 0 | |||||
| 2025-08-13 | 13F | Legacy Capital Wealth Partners, LLC | 59,024 | -2.02 | 1,301 | -3.27 | ||||
| 2025-08-11 | 13F | Core Wealth Partners LLC | 11,520 | 0.00 | 254 | -1.56 | ||||
| 2025-05-14 | 13F | Mml Investors Services, Llc | 0 | -100.00 | 0 | |||||
| 2025-07-24 | 13F | Us Bancorp \de\ | 13,756 | 0.00 | 303 | -1.30 | ||||
| 2025-07-21 | 13F | Mirae Asset Global Investments Co., Ltd. | 0 | -100.00 | 0 | |||||
| 2025-08-12 | 13F | AlphaCore Capital LLC | 0 | -100.00 | 0 | |||||
| 2025-05-15 | 13F | Oxford Asset Management Llp | 11,392 | 254 | ||||||
| 2025-08-13 | 13F | Guggenheim Capital Llc | 24,606 | 6.50 | 542 | 5.24 | ||||
| 2025-05-15 | 13F | Lido Advisors, LLC | 0 | -100.00 | 0 | -100.00 | ||||
| 2025-08-12 | 13F | MAI Capital Management | 3,524 | 32.53 | 78 | 30.51 | ||||
| 2025-08-05 | 13F | Dunhill Financial, LLC | 400 | 9 | ||||||
| 2025-08-14 | 13F | Colony Group, LLC | 9,272 | -1.80 | 204 | -2.86 | ||||
| 2025-08-13 | 13F/A | DLD Asset Management, LP | Put | 0 | -100.00 | 0 | ||||
| 2025-04-29 | 13F | Concurrent Investment Advisors, LLC | 0 | -100.00 | 0 | |||||
| 2025-07-11 | 13F | Kingstone Capital Partners Texas, LLC | 13,089,875 | 311 | ||||||
| 2025-08-14 | 13F | Schonfeld Strategic Advisors LLC | 66,243 | -43.64 | 1,460 | -44.38 | ||||
| 2025-08-15 | 13F | Kestra Advisory Services, LLC | 45,856 | -2.20 | 1,011 | -3.44 | ||||
| 2025-08-15 | 13F | CI Private Wealth, LLC | 0 | -100.00 | 0 | |||||
| 2025-06-25 | NP | VPC - Virtus Private Credit Strategy ETF | 40,343 | 1.45 | 822 | -8.16 | ||||
| 2025-08-05 | 13F | Huntington National Bank | 2 | 0.00 | 0 | |||||
| 2025-08-27 | 13F/A | Squarepoint Ops LLC | 11,613 | -1.76 | 256 | -3.04 | ||||
| 2025-08-14 | 13F | Point72 Asia (Singapore) Pte. Ltd. | 1,894 | 42 | ||||||
| 2025-08-14 | 13F | Evergreen Capital Management Llc | 0 | -100.00 | 0 | |||||
| 2025-08-14 | 13F | DRW Securities, LLC | 24,985 | 148.11 | 551 | 145.54 | ||||
| 2025-08-12 | 13F | BlackRock, Inc. | 320,720 | 22.49 | 7,069 | 20.94 | ||||
| 2025-08-12 | 13F | CIBC Private Wealth Group, LLC | 1,551 | -0.06 | 34 | 25.93 | ||||
| 2025-07-30 | 13F | Atlantic Edge Private Wealth Management, LLC | 200 | 0.00 | 4 | 0.00 | ||||
| 2025-08-13 | 13F | Invesco Ltd. | 34,003 | 21.84 | 749 | 20.42 | ||||
| 2025-06-30 | NP | PSP - Invesco Global Listed Private Equity ETF This fund is a listed as child fund of Invesco Ltd. and if that institution has disclosed ownership in this security, then these positions will not be double counted when calculating total shares and total value | 26,473 | -18.88 | 540 | -26.57 | ||||
| 2025-08-14 | 13F | Aquatic Capital Management LLC | 13,329 | -42.49 | 294 | -43.33 | ||||
| 2025-08-13 | 13F | Capital Analysts, Inc. | 2,685 | 2.64 | 0 | |||||
| 2025-08-14 | 13F | VPR Management LLC | 2,500 | 55 | ||||||
| 2025-07-23 | NP | FAAAX - Franklin K2 Alternative Strategies Fund Class A | Short | -612 | -37.30 | -13 | -45.45 | |||
| 2025-08-12 | 13F/A | Cozad Asset Management Inc | 49,161 | 4.26 | 1,084 | 2.95 | ||||
| 2025-06-27 | NP | LBO - WHITEWOLF Publicly Listed Private Equity ETF | 7,035 | 14.28 | 143 | 3.62 | ||||
| 2025-08-18 | 13F | Geneos Wealth Management Inc. | 1,930 | 0.00 | 43 | -2.33 | ||||
| 2025-08-13 | 13F | Northern Trust Corp | 45,690 | 286.16 | 1,007 | 281.44 | ||||
| 2025-08-15 | 13F | Zuckerman Investment Group, LLC | 460,375 | 7.81 | 10,147 | 6.45 | ||||
| 2025-08-14 | 13F | Hrt Financial Lp | 242,080 | 176.04 | 5 | 400.00 | ||||
| 2025-08-14 | 13F | Summit Trail Advisors, Llc | 10,630 | 234 | ||||||
| 2025-07-25 | 13F | Apollon Wealth Management, LLC | 23,797 | 10.69 | 524 | 9.39 | ||||
| 2025-08-14 | 13F | Qube Research & Technologies Ltd | 63,474 | -73.19 | 1,399 | -73.54 | ||||
| 2025-08-14 | 13F | Two Sigma Investments, Lp | 761,221 | -4.67 | 16,777 | -5.86 | ||||
| 2025-07-01 | 13F | Confluence Investment Management Llc | 102,107 | 0.58 | 2,250 | -0.66 | ||||
| 2025-07-23 | 13F | Mraz, Amerine & Associates, Inc. | 42,958 | -1.77 | 947 | -3.27 | ||||
| 2025-08-21 | NP | BIZD - VanEck Vectors BDC Income ETF | 1,241,902 | 11.47 | 27,372 | 10.07 | ||||
| 2025-05-05 | 13F | Lindbrook Capital, Llc | 0 | -100.00 | 0 | |||||
| 2025-08-14 | 13F | Millennium Management Llc | 526,734 | 7.72 | 11,609 | 6.37 | ||||
| 2025-08-18 | 13F | Hollencrest Capital Management | 7,055 | 2.62 | 155 | 1.31 | ||||
| 2025-08-11 | 13F | HighTower Advisors, LLC | 10,190 | 8.54 | 225 | 7.18 | ||||
| 2025-07-08 | 13F | Parallel Advisors, LLC | 4,185 | -4.93 | 92 | -6.12 | ||||
| 2025-08-07 | 13F | Campbell & CO Investment Adviser LLC | 20,873 | -2.29 | 460 | -3.36 | ||||
| 2025-05-14 | 13F | Comerica Bank | 0 | -100.00 | 0 | |||||
| 2025-05-07 | 13F | Spectrum Wealth Counsel, LLC | 230 | 0.00 | 5 | 0.00 | ||||
| 2025-08-14 | 13F | Two Sigma Advisers, Lp | 983,500 | -3.09 | 21,676 | -4.31 | ||||
| 2025-08-07 | 13F | First Dallas Securities Inc. | 77,102 | 7.20 | 1,699 | 5.86 | ||||
| 2025-05-16 | 13F | Jones Financial Companies Lllp | 0 | -100.00 | 0 | |||||
| 2025-07-18 | 13F | Generali Investments CEE, investicni spolecnost, a.s. | 12,628 | 0.00 | 278 | -1.07 | ||||
| 2025-08-28 | NP | TRIFX - Catalyst/SMH Total Return Income Fund Class A | 20,000 | 0.00 | 441 | -1.35 | ||||
| 2025-07-18 | 13F | Union Bancaire Privee, UBP SA | 14,349 | 5.08 | 45,130 | 14,745.07 | ||||
| 2025-07-22 | 13F | Autumn Glory Partners, LLC | 26,000 | 0.00 | 573 | -1.21 | ||||
| 2025-08-01 | 13F | Y-Intercept (Hong Kong) Ltd | 48,215 | 1,063 | ||||||
| 2025-08-12 | 13F | Global Retirement Partners, LLC | 12,695 | -50.37 | 280 | -50.00 | ||||
| 2025-08-14 | 13F | Bank Of America Corp /de/ | 28,036 | -54.51 | 618 | -55.13 | ||||
| 2025-08-05 | 13F | Bard Associates Inc | 17,256 | 0.00 | 380 | -1.30 | ||||
| 2025-08-13 | 13F | Lansforsakringar Fondforvaltning AB (publ) | 0 | -100.00 | 0 | |||||
| 2025-07-15 | 13F | Fortitude Family Office, LLC | 1,400 | 31 | ||||||
| 2025-08-06 | 13F | Commonwealth Equity Services, Llc | 79,788 | 2.90 | 2 | 0.00 | ||||
| 2025-08-14 | 13F | Group One Trading, L.p. | Put | 4,000 | -75.46 | 88 | -75.76 | |||
| 2025-07-03 | 13F | Garde Capital, Inc. | 2,401 | 0.00 | 53 | -1.89 | ||||
| 2025-07-09 | 13F | Epiq Partners, Llc | 266,800 | 4.46 | 5,880 | 3.16 | ||||
| 2025-07-09 | 13F | Lbmc Investment Advisors, Llc | 18,250 | 0.00 | 402 | -1.23 | ||||
| 2025-08-14 | 13F | Group One Trading, L.p. | Call | 15,300 | -19.47 | 337 | -20.52 | |||
| 2025-07-16 | 13F | Signaturefd, Llc | 2,483 | 51.96 | 55 | 50.00 | ||||
| 2025-08-13 | 13F | ExodusPoint Capital Management, LP | 24,975 | -36.13 | 1 | |||||
| 2025-07-25 | 13F | LRI Investments, LLC | 250 | 0.00 | 6 | 0.00 | ||||
| 2025-08-06 | 13F | Wedbush Securities Inc | 11,723 | 0 | ||||||
| 2025-07-31 | 13F | Washington Trust Advisors, Inc. | 5,000 | 0.00 | 110 | -0.90 | ||||
| 2025-08-14 | 13F | Sciencast Management LP | 0 | -100.00 | 0 | |||||
| 2025-08-14 | 13F | Citadel Advisors Llc | Put | 65,600 | -8.64 | 1,446 | -9.80 | |||
| 2025-07-22 | 13F | Gsa Capital Partners Llp | 17,874 | 0 | ||||||
| 2025-08-14 | 13F | Atom Investors LP | 19,751 | 435 | ||||||
| 2025-08-04 | 13F | Wolverine Asset Management Llc | Put | 25,600 | 564 | |||||
| 2025-08-13 | 13F | OMERS ADMINISTRATION Corp | 34,900 | 769 | ||||||
| 2025-08-14 | 13F | Citadel Advisors Llc | 409,241 | 22.74 | 9,020 | 21.21 | ||||
| 2025-07-28 | 13F | Mutual Advisors, LLC | 9,244 | -46.81 | 216 | -38.75 | ||||
| 2025-08-11 | 13F | Delta Asset Management Llc/tn | 70 | 0.00 | 2 | 0.00 | ||||
| 2025-07-14 | 13F | Toth Financial Advisory Corp | 600 | -10.45 | 13 | -7.14 | ||||
| 2025-08-13 | 13F | Marshall Wace, Llp | 147,162 | -40.84 | 3,243 | -41.59 | ||||
| 2025-08-15 | 13F | Great West Life Assurance Co /can/ | 51,018 | 5.74 | 1 | 0.00 | ||||
| 2025-08-01 | 13F | Envestnet Asset Management Inc | 335,718 | 639.74 | 7,399 | 631.13 | ||||
| 2025-08-08 | 13F | Larson Financial Group LLC | 1,000 | 0.00 | 22 | 0.00 | ||||
| 2025-08-14 | 13F | First Manhattan Co | 258,986 | -9.80 | 5,708 | -10.92 | ||||
| 2025-07-23 | 13F | Tcfg Wealth Management, Llc | 0 | -100.00 | 0 | |||||
| 2025-08-07 | 13F | ProShare Advisors LLC | 9,909 | 0.51 | 218 | -0.91 | ||||
| 2025-08-08 | 13F | Avantax Advisory Services, Inc. | 10,830 | -2.93 | 239 | -4.42 | ||||
| 2025-08-14 | 13F | D. E. Shaw & Co., Inc. | 26,960 | 5.42 | 594 | 4.21 | ||||
| 2025-05-14 | 13F | Virtus ETF Advisers LLC | 0 | -100.00 | 0 | |||||
| 2025-08-14 | 13F | Ameriprise Financial Inc | 69,501 | -23.33 | 1,532 | -24.36 | ||||
| 2025-08-07 | 13F | Hennion & Walsh Asset Management, Inc. | 79,511 | -38.49 | 1,752 | -39.27 | ||||
| 2025-08-14 | 13F | Palisade Capital Management Llc/nj | 10,747 | 0.00 | 237 | -1.26 | ||||
| 2025-08-08 | 13F | Foundations Investment Advisors, LLC | 118,196 | 10.80 | 2,605 | 9.45 | ||||
| 2025-08-12 | 13F | Cornerstone Wealth Management, LLC | 43,005 | 1.62 | 948 | 0.32 | ||||
| 2025-07-31 | 13F | Catalyst Capital Advisors LLC | 20,000 | 0.00 | 441 | -1.35 | ||||
| 2025-08-14 | 13F | Citadel Advisors Llc | Call | 0 | -100.00 | 0 | ||||
| 2025-08-13 | 13F | Northwestern Mutual Wealth Management Co | 4,000 | 0.00 | 88 | -1.12 | ||||
| 2025-08-04 | 13F | Spire Wealth Management | 600 | 0.00 | 13 | 0.00 |
Other Listings
| DE:SFW | €19.83 |