Statistik Asas
| Pemilik Institusi | 479 total, 474 long only, 1 short only, 4 long/short - change of 0.42% MRQ |
| Purata Peruntukan Portfolio | 0.8091 % - change of 70.67% MRQ |
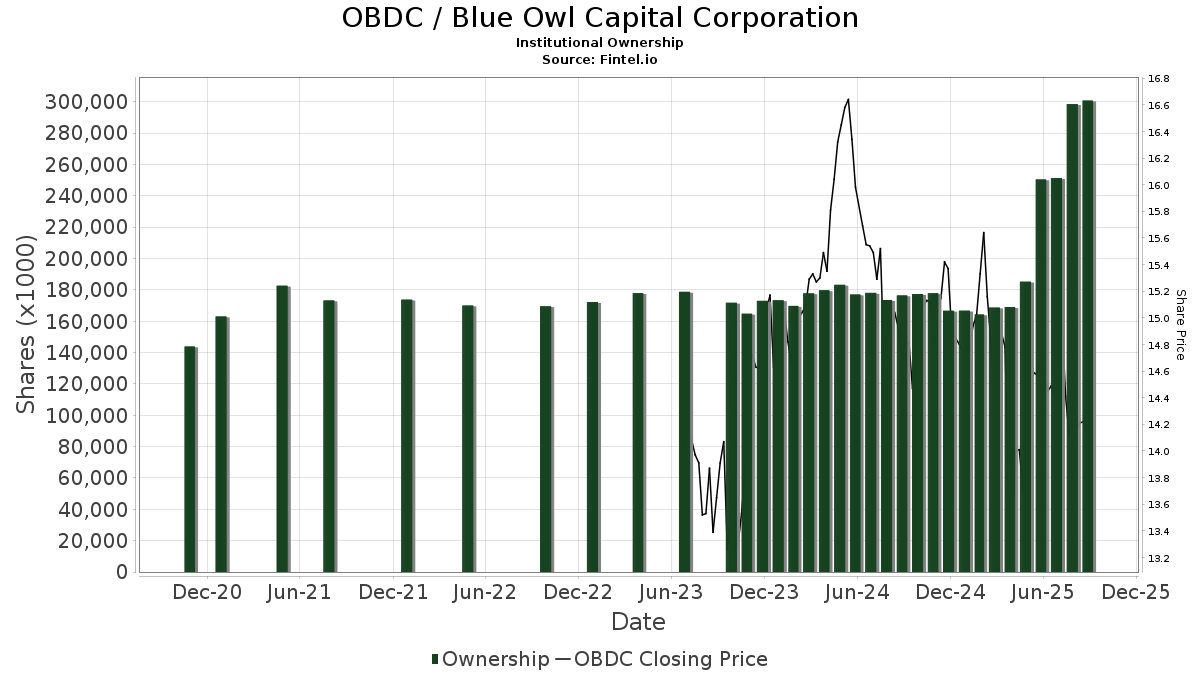
| Saham Institusi (Panjang) | 300,962,377 (ex 13D/G) - change of 50.34MM shares 20.09% MRQ |
| Nilai Institusi (Panjang) | $ 3,387,098 USD ($1000) |
Pemilikan Institusi dan Pemegang Saham
Blue Owl Capital Corporation (US:OBDC) telah 479 pemilik institusi dan pemegang saham yang telah memfailkan borang 13D/G atau 13F dengan Suruhanjaya Bursa Sekuriti (SEC). Institusi ini memegang sejumlah 300,962,377 saham. Pemegang saham terbesar termasuk Kingstone Capital Partners Texas, LLC, California State Teachers Retirement System, Oregon Public Employees Retirement Fund, State of New Jersey Common Pension Fund A, Van Eck Associates Corp, Bank Of America Corp /de/, BIZD - VanEck Vectors BDC Income ETF, Fmr Llc, Morgan Stanley, and FDGFX - Fidelity Dividend Growth Fund .
Blue Owl Capital Corporation (NYSE:OBDC) struktur pemilikan institusi menunjukkan kedudukan semasa dalam syarikat mengikut institusi dan dana serta perubahan terkini dalam saiz kedudukan. Pemegang saham utama boleh termasuk pelabur individu, dana amanah, dana lindung nilai atau institusi. Jadual 13D menunjukkan bahawa pelabur memegang (atau menahan) lebih daripada 5% syarikat dan berhasrat (atau berniat) untuk secara aktif meneruskan perubahan dalam strategi perniagaan. Jadual 13G menunjukkan pelaburan pasif melebihi 5%.
The share price as of September 3, 2025 is 14.24 / share. Previously, on September 4, 2024, the share price was 14.93 / share. This represents a decline of 4.62% over that period.
Skor Sentimen Dana
Skor Sentimen Dana (Skor Pengumpulan Pemilikan fka) mencari saham yang paling banyak dibeli oleh dana. Ia adalah hasil daripada model kuantitatif pelbagai faktor yang canggih yang mengenal pasti syarikat dengan tahap pengumpulan institusi tertinggi. Model pemarkahan ini menggunakan gabungan jumlah kenaikan dalam pemilik yang didedahkan, perubahan dalam peruntukan portfolio dalam pemilik tersebut dan metrik lain. Nombornya berjulat dari 0 hingga 100, dengan nombor yang lebih tinggi menunjukkan tahap pengumpulan yang lebih tinggi kepada rakannya, dan 50 adalah nombor purata.
Kekerapan Kemas Kini: Harian
Lihat Peneroka Pemilikan yang menyediakan senarai syarikat yang mempunyai kedudukan tertinggi.
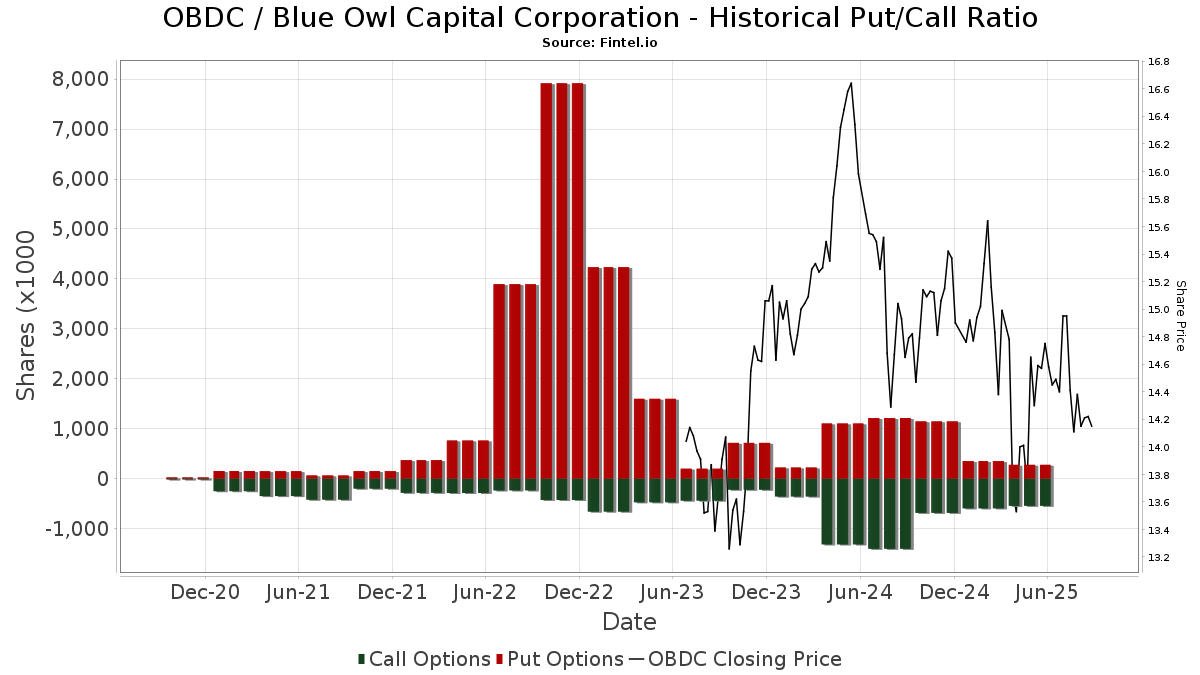
Nisbah Put/Call Institusi
Selain melaporkan isu ekuiti dan hutang standard, institusi yang mempunyai lebih daripada 100MM aset di bawah pengurusan juga mesti mendedahkan pegangan opsyen jual dan beli mereka. Memandangkan opsyen jual secara amnya menunjukkan sentimen negatif, dan opsyen beli menunjukkan sentimen positif, kita boleh mendapatkan gambaran keseluruhan sentimen institusi dengan merencanakan nisbah jual kepada beli. Carta di sebelah kanan memplotkan nisbah jual/beli sejarah untuk instrumen ini.
Menggunakan Nisbah Put/Callsebagai penunjuk sentimen pelabur mengatasi salah satu kekurangan utama menggunakan jumlah pemilikan institusi, iaitu sejumlah besar aset di bawah pengurusan dilaburkan secara pasif untuk menjejaki indeks. Dana yang diurus secara pasif biasanya tidak membeli opsyen, jadi penunjuk nisbah put/call mengekori rapat sentimen dana yang diurus secara aktif.
Pemfailan 13D/G
Kami membentangkan pemfailan 13D/G secara berasingan daripada pemfailan 13F kerana layanan yang berbeza oleh SEC. Pemfailan 13D/G boleh difailkan oleh kumpulan pelabur (dengan satu peneraju), manakala pemfailan 13F tidak boleh. Ini mengakibatkan situasi di mana pelabur yang boleh memfailkan 13D/G melaporkan satu nilai untuk jumlah saham (mewakili semua saham yang dimiliki oleh kumpulan pelabur), tetapi kemudian memfailkan 13F dengan melaporkan nilai yang berbeza untuk jumlah saham (mewakili sepenuhnya saham mereka sendiri. pemilikan). Ini bermakna pemilikan saham pemfailan 13D/G dan pemfailan 13F selalunya tidak dapat dibandingkan secara langsung, jadi kami membentangkannya secara berasingan.
Nota: Mulai 16 Mei 2021, kami tidak lagi menunjukkan pemilik yang tidak memfailkan 13D/G pada tahun lepas. Sebelum ini, kami telah menunjukkan sejarah penuh pemfailan 13D/G. Secara umum, entiti yang dikehendaki memfailkan pemfailan 13D/G mesti memfailkan sekurang-kurangnya setiap tahun sebelum menyerahkan pemfailan penutup. Walau bagaimanapun, dana kadangkala keluar dari jawatan tanpa menyerahkan pemfailan penutup (iaitu, ia ditamatkan), jadi memaparkan sejarah penuh kadangkala boleh mengakibatkan kekeliruan tentang pemilikan semasa. Untuk mengelakkan kekeliruan, kini kami hanya menunjukkan pemilik "semasa" - iaitu - pemilik yang telah memfailkan pada tahun lepas.
Upgrade to unlock premium data.
| Tarikh Fail | Borang | Pelabur | Saham Terdahulu |
Saham Terkini |
ΔSaham (Peratus) |
Pemilikan (Peratus) |
ΔPemilikan (Peratus) |
|
|---|---|---|---|---|---|---|---|---|
| 2025-01-16 | State of New Jersey Common Pension Fund E | 22,751,338 | 4.45 |
Pemfailan 13F dan NPORT
Butiran mengenai pemfailan 13F adalah percuma. Perincian mengenai pemfailan NP memerlukan keahlian premium. Baris hijau menunjukkan kedudukan baharu. Baris merah menunjukkan kedudukan tertutup. Klik pautan ikon untuk melihat sejarah transaksi penuh.
Naik Taraf
untuk membuka data premium dan mengeksport ke Excel ![]() .
.
| Tarikh Fail | Sumber | Pelabur | Jenis | Purata Harga (Ang) |
Saham | ΔSaham (%) |
Nilai Dilaporkan ($1000) |
Δ Nilai (%) |
Peruntukan Port (%) |
|
|---|---|---|---|---|---|---|---|---|---|---|
| 2025-08-12 | 13F | LPL Financial LLC | 2,374,002 | 14.36 | 34,043 | 11.87 | ||||
| 2025-04-30 | 13F | Sofos Investments, Inc. | 60,520 | 1,512,900.00 | 887 | |||||
| 2025-08-14 | 13F | Quarry LP | 688 | -6.90 | 10 | -18.18 | ||||
| 2025-08-12 | 13F | Advisors Asset Management, Inc. | 494,859 | 15.08 | 7,096 | 12.56 | ||||
| 2025-07-23 | 13F | Joel Isaacson & Co., LLC | 19,789 | 19.29 | 284 | 16.46 | ||||
| 2025-08-04 | 13F | Flagship Harbor Advisors, Llc | 14,080 | 1.08 | 202 | -1.47 | ||||
| 2025-08-14 | 13F | Diversify Wealth Management, Llc | 35,541 | 33.29 | 508 | 34.13 | ||||
| 2025-08-04 | 13F | Assetmark, Inc | 0 | -100.00 | 0 | |||||
| 2025-08-06 | 13F | First Horizon Advisors, Inc. | 2,811 | 40 | ||||||
| 2025-08-14 | 13F | FIL Ltd | 0 | -100.00 | 0 | |||||
| 2025-04-11 | 13F | First Affirmative Financial Network | 15,158 | -19.08 | 222 | -21.55 | ||||
| 2025-08-05 | 13F | Integrity Financial Corp /WA | 26,508 | 1.75 | 390 | -0.51 | ||||
| 2025-08-14 | 13F | Boston Private Wealth Llc | 0 | -100.00 | 0 | |||||
| 2025-07-14 | 13F | Westend Capital Management LLC | 5,178 | -2.15 | 74 | -3.90 | ||||
| 2025-08-14 | 13F | State Street Corp | 441,053 | 257.75 | 6,487 | 250.22 | ||||
| 2025-06-18 | NP | Putnam ETF Trust - Putnam BDC ETF - | 1,826,480 | 71.56 | 25,589 | 59.07 | ||||
| 2025-07-11 | 13F | Farther Finance Advisors, LLC | 12,579 | -9.21 | 180 | -12.20 | ||||
| 2025-08-01 | 13F | State of New Jersey Common Pension Fund A | 15,263,873 | 218,884 | ||||||
| 2025-08-14 | 13F | Ubs Asset Management Americas Inc | 0 | -100.00 | 0 | |||||
| 2025-05-27 | NP | FPX - First Trust US Equity Opportunities ETF This fund is a listed as child fund of First Trust Advisors Lp and if that institution has disclosed ownership in this security, then these positions will not be double counted when calculating total shares and total value | 180,610 | 40.35 | 2,648 | 36.09 | ||||
| 2025-07-23 | 13F | WESPAC Advisors, LLC | 113,657 | 1.34 | 1,630 | -0.91 | ||||
| 2025-08-08 | 13F | Pnc Financial Services Group, Inc. | 2,000 | -68.29 | 29 | -69.57 | ||||
| 2025-04-28 | 13F | Zwj Investment Counsel Inc | 0 | -100.00 | 0 | |||||
| 2025-06-10 | 13F | Birchbrook, Inc. | 0 | -100.00 | 0 | -100.00 | ||||
| 2025-07-23 | 13F | Trustees of Dartmouth College | 3,326,984 | 0.00 | 47,709 | -2.18 | ||||
| 2025-08-12 | 13F | TCTC Holdings, LLC | 10,862 | 0.00 | 156 | -2.52 | ||||
| 2025-08-05 | 13F | Gilbert & Cook, Inc. | 216,317 | -25.32 | 3,102 | -26.97 | ||||
| 2025-07-29 | NP | SSMAX - Siit Small Mid Cap Equity Fund - Class A | 69,500 | 0.00 | 1,018 | -5.21 | ||||
| 2025-07-29 | NP | BPSIX - Boston Partners Small Cap Value Fund II INSTITUTIONAL | 192,967 | 17.73 | 2,827 | 11.57 | ||||
| 2025-08-06 | 13F | Round Rock Advisors, LLC | 141,071 | 4.82 | 2,023 | 2.48 | ||||
| 2025-08-14 | 13F | EP Wealth Advisors, Inc. | 282,084 | 0.00 | 4,045 | -2.18 | ||||
| 2025-07-24 | 13F | Robertson Stephens Wealth Management, LLC | 25,830 | 0.00 | 380 | -2.32 | ||||
| 2025-07-25 | 13F | Tranquility Partners, LLC | 154,855 | 0.95 | 2,221 | -1.25 | ||||
| 2025-08-14 | 13F | Mariner, LLC | 1,424,237 | 10.99 | 20,424 | 8.56 | ||||
| 2025-08-12 | 13F | J.w. Cole Advisors, Inc. | 23,699 | -11.68 | 340 | -13.74 | ||||
| 2025-07-23 | 13F | Venturi Wealth Management, LLC | 24,600 | 141.18 | 353 | 136.24 | ||||
| 2025-07-22 | 13F | MAS Advisors LLC | 28,173 | 4.10 | 404 | 2.02 | ||||
| 2025-07-28 | 13F | Melia Wealth LLC | 1,058,832 | 5.70 | 15,184 | 3.40 | ||||
| 2025-08-13 | 13F | GeoWealth Management, LLC | 973 | 0.00 | 14 | -7.14 | ||||
| 2025-08-12 | 13F | SRS Capital Advisors, Inc. | 31 | 0 | ||||||
| 2025-05-02 | 13F | BluePointe Capital Management, LLC | 174,469 | 20.37 | 2,622 | 16.95 | ||||
| 2025-08-07 | 13F | Addison Advisors LLC | 499 | 0.00 | 7 | 0.00 | ||||
| 2025-08-12 | 13F | Archer Investment Corp | 406 | 0.50 | 6 | 0.00 | ||||
| 2025-07-28 | 13F | Ritholtz Wealth Management | 21,157 | -35.02 | 303 | -36.48 | ||||
| 2025-08-11 | 13F | Hexagon Capital Partners LLC | 0 | -100.00 | 0 | |||||
| 2025-05-15 | 13F | Parallax Volatility Advisers, L.P. | Put | 0 | -100.00 | 0 | -100.00 | |||
| 2025-08-12 | 13F | BlackRock, Inc. | 2,965,944 | 32.30 | 42,532 | 29.41 | ||||
| 2025-07-28 | 13F | Pettinga Financial Advisors, LLC | 80,639 | -60.26 | 1,156 | -61.13 | ||||
| 2025-08-27 | NP | OASVX - Optimum Small-mid Cap Value Fund Class A | 77,200 | 0.00 | 1,107 | -2.12 | ||||
| 2025-08-13 | 13F | Colony Capital, Inc. | Put | 0 | -100.00 | 0 | ||||
| 2025-08-12 | 13F | Legal & General Group Plc | 471,823 | 4.31 | 6,768 | 2.11 | ||||
| 2025-07-15 | 13F | Family Wealth Partners, Llc | 35,949 | 85.07 | 516 | 81.34 | ||||
| 2025-08-13 | 13F | Fiduciary Group LLC | 46,151 | 26.48 | 662 | 23.78 | ||||
| 2025-07-15 | 13F | Graypoint LLC | 590,048 | 49.36 | 8,461 | 46.11 | ||||
| 2025-07-15 | 13F | SJS Investment Consulting Inc. | 787 | 0.00 | 11 | 0.00 | ||||
| 2025-08-08 | 13F | Brown University | 4,348,863 | 0.00 | 62,363 | -2.18 | ||||
| 2025-08-06 | 13F | Csenge Advisory Group | 52,708 | 0.00 | 772 | 5.75 | ||||
| 2025-08-14 | 13F | Fieldview Capital Management, LLC | 158,007 | -51.41 | 2,266 | -52.49 | ||||
| 2025-04-29 | NP | SWSAX - SIIT World Select Equity Fund Class A | 6,200 | 0.00 | 96 | 1.06 | ||||
| 2025-07-29 | NP | PPADX - GMO U.S. Opportunistic Value Fund Class III | 27,862 | -79.33 | 408 | -80.41 | ||||
| 2025-07-30 | 13F | Green Square Capital Advisors Llc | 174,200 | 2,498 | ||||||
| 2025-08-19 | 13F | National Asset Management, Inc. | 34,081 | -21.81 | 489 | -27.70 | ||||
| 2025-08-29 | NP | GABF - Gabelli Financial Services Opportunities ETF | 1,084 | -96.18 | 16 | -96.39 | ||||
| 2025-07-22 | 13F | Apexium Financial, Lp | 17,581 | 0.46 | 252 | -4.18 | ||||
| 2025-08-11 | 13F | Anfield Capital Management, LLC | 17,214 | 0.00 | 247 | -2.38 | ||||
| 2025-08-13 | 13F | Capital Fund Management S.a. | 0 | -100.00 | 0 | |||||
| 2025-07-23 | 13F | Nbt Bank N A /ny | 2,200 | 0.00 | 32 | -3.12 | ||||
| 2025-08-12 | 13F | Proequities, Inc. | 0 | 0 | ||||||
| 2025-08-18 | 13F/A | National Bank Of Canada /fi/ | 12,698 | 2,523.55 | 182 | 2,500.00 | ||||
| 2025-05-14 | 13F | Group One Trading, L.p. | 0 | -100.00 | 0 | -100.00 | ||||
| 2025-08-14 | 13F | Vident Advisory, LLC | 14,907 | 214 | ||||||
| 2025-05-02 | 13F | DecisionPoint Financial, LLC | 0 | -100.00 | 0 | -100.00 | ||||
| 2025-08-15 | 13F | DCM Advisors, LLC | 23,539 | -6.92 | 322 | -12.26 | ||||
| 2025-08-14 | 13F | Icon Wealth Advisors, LLC | 58,454 | 2.05 | 838 | -0.12 | ||||
| 2025-05-08 | 13F | Tandem Financial, LLC | 0 | -100.00 | 0 | |||||
| 2025-08-14 | 13F | Royal Bank Of Canada | 7,976,125 | 4.83 | 114,377 | 2.54 | ||||
| 2025-05-12 | 13F | Townsquare Capital Llc | 0 | -100.00 | 0 | |||||
| 2025-07-09 | 13F | Mirador Capital Partners LP | 32,673 | 5.32 | 469 | 3.08 | ||||
| 2025-08-12 | 13F | Fortem Financial Group, Llc | 189,195 | 39.43 | 2,713 | 36.40 | ||||
| 2025-08-14 | 13F | Fmr Llc | 11,738,509 | 16.36 | 168,330 | 13.82 | ||||
| 2025-08-14 | 13F | Capital Planning Advisors, LLC | 36,029 | 0.00 | 517 | -2.27 | ||||
| 2025-08-08 | 13F | Citizens Financial Group Inc/ri | 85,235 | 0.00 | 1,222 | -2.16 | ||||
| 2025-08-13 | 13F | Lido Advisors, LLC | 444,235 | 129.81 | 6,525 | 125.31 | ||||
| 2025-05-14 | 13F | Campbell & CO Investment Adviser LLC | 0 | -100.00 | 0 | |||||
| 2025-07-28 | 13F | Twin Tree Management, LP | Call | 18,700 | 16.15 | 268 | 13.56 | |||
| 2025-05-14 | 13F | Brown Brothers Harriman & Co | 0 | -100.00 | 0 | |||||
| 2025-05-15 | 13F | Talon Private Wealth, LLC | 0 | -100.00 | 0 | -100.00 | ||||
| 2025-08-14 | 13F | Bank Of America Corp /de/ | 12,463,438 | 4.33 | 178,726 | 2.05 | ||||
| 2025-08-14 | 13F | Capstone Investment Advisors, Llc | 55,959 | 802 | ||||||
| 2025-08-12 | 13F | MAI Capital Management | 732,867 | -6.17 | 10,509 | -8.22 | ||||
| 2025-08-13 | 13F | Texas Capital Bancshares Inc/tx | 66,679 | 0.00 | 956 | -2.15 | ||||
| 2025-08-13 | 13F | Keystone Financial Group | 10,592 | 152 | ||||||
| 2025-07-14 | 13F | Gries Financial Llc | 80,778 | -6.66 | 1,158 | -8.68 | ||||
| 2025-07-15 | 13F | Accurate Wealth Management, LLC | 24,766 | -3.66 | 362 | 6.16 | ||||
| 2025-07-08 | 13F/A | Salem Investment Counselors Inc | 372,915 | -0.11 | 5,354 | -2.28 | ||||
| 2025-07-09 | 13F | Bruce G. Allen Investments, LLC | 47 | 0.00 | 1 | |||||
| 2025-08-26 | NP | GMOV - GMO U.S. Value ETF | 3,117 | -47.07 | 45 | -48.84 | ||||
| 2025-08-06 | 13F | Savant Capital, LLC | 14,082 | 4.47 | 202 | 2.03 | ||||
| 2025-08-14 | 13F | Visionary Wealth Advisors | 33,316 | -8.06 | 478 | -10.17 | ||||
| 2025-08-04 | 13F | Spire Wealth Management | 3,396 | 21.29 | 49 | 17.07 | ||||
| 2025-08-27 | NP | BBVSX - Bridge Builder Small/Mid Cap Value Fund | 243,300 | 0.00 | 3,489 | -2.19 | ||||
| 2025-07-31 | 13F | Cambridge Investment Research Advisors, Inc. | 334,975 | 0.14 | 5 | 0.00 | ||||
| 2025-08-06 | 13F | Founders Financial Securities Llc | 10,000 | 0.00 | 143 | 0.00 | ||||
| 2025-08-14 | 13F | BI Asset Management Fondsmaeglerselskab A/S | 2,599 | 0.00 | 0 | |||||
| 2025-08-13 | 13F | Quantbot Technologies LP | 170,166 | 2,440 | ||||||
| 2025-08-12 | 13F | AlphaCore Capital LLC | 337,011 | -12.16 | 4,833 | -16.21 | ||||
| 2025-08-05 | 13F | Simplex Trading, Llc | 0 | -100.00 | 0 | |||||
| 2025-08-22 | 13F/A | TT Capital Management LLC | 274,268 | 9.30 | 3,933 | 6.93 | ||||
| 2025-08-01 | 13F | First National Trust Co | 210,084 | 0.00 | 3,013 | -2.18 | ||||
| 2025-05-08 | 13F | Bank of Jackson Hole Trust | 0 | -100.00 | 0 | |||||
| 2025-08-11 | 13F | Greenland Capital Management LP | 36,682 | 526 | ||||||
| 2025-08-11 | 13F | United Advisor Group, LLC | 27,648 | 2.25 | 396 | 0.00 | ||||
| 2025-08-14 | 13F | Quantinno Capital Management LP | 161,276 | 1,194.25 | 2,313 | 1,170.33 | ||||
| 2025-05-15 | 13F | Almitas Capital LLC | Put | 0 | -100.00 | 0 | ||||
| 2025-08-15 | 13F | Morgan Stanley | 10,191,589 | 23.61 | 146,147 | 20.91 | ||||
| 2025-08-14 | 13F | Ariadne Wealth Management, LP | 0 | -100.00 | 0 | |||||
| 2025-08-20 | NP | LSPAX - LoCorr Spectrum Income Fund Class A | 45,804 | 0.00 | 657 | -2.24 | ||||
| 2025-08-13 | 13F | Cary Street Partners Financial Llc | 101,048 | -1.56 | 1,449 | -3.66 | ||||
| 2025-08-14 | 13F | Price T Rowe Associates Inc /md/ | 13,100 | 0 | ||||||
| 2025-07-25 | 13F | Apollon Wealth Management, LLC | 131,422 | 1.42 | 1,885 | -0.79 | ||||
| 2025-07-30 | 13F | Dudley Capital Management, Llc | 59,770 | -0.33 | 857 | -2.50 | ||||
| 2025-08-12 | 13F | YANKCOM Partnership | 66 | 0.00 | 1 | |||||
| 2025-08-14 | 13F | Harwood Advisory Group, LLC | 942 | 14 | ||||||
| 2025-08-14 | 13F | CIBC World Markets Inc. | 38,363 | -6.95 | 550 | -8.94 | ||||
| 2025-03-20 | NP | QRFT - QRAFT AI-Enhanced U.S. Large Cap ETF | 506 | 438.30 | 8 | 600.00 | ||||
| 2025-07-07 | 13F | Roxbury Financial LLC | 0 | -100.00 | 0 | |||||
| 2025-07-16 | 13F | Essex Financial Services, Inc. | 31,300 | 0.00 | 449 | -2.18 | ||||
| 2025-07-10 | 13F | Wealth Enhancement Advisory Services, Llc | 62,181 | 17.37 | 910 | 17.14 | ||||
| 2025-08-08 | 13F | CFO4Life Group, LLC | 22,444 | 0.48 | 322 | -1.83 | ||||
| 2025-08-14 | 13F | Two Sigma Securities, Llc | 23,162 | 332 | ||||||
| 2025-07-14 | 13F | AdvisorNet Financial, Inc | 1,392 | 0.07 | 20 | -5.00 | ||||
| 2025-08-14 | 13F | Beaird Harris Wealth Management, LLC | 1,400 | 0.00 | 20 | 0.00 | ||||
| 2025-08-27 | NP | Advanced Series Trust - Ast Small-cap Growth Portfolio | 156,214 | 2.80 | 2,240 | 0.58 | ||||
| 2025-08-14 | 13F | IPG Investment Advisors LLC | 20,155 | -25.14 | 296 | -26.73 | ||||
| 2025-07-25 | NP | First Trust Specialty Finance & Financial Opportunities Fund This fund is a listed as child fund of First Trust Advisors Lp and if that institution has disclosed ownership in this security, then these positions will not be double counted when calculating total shares and total value | 244,475 | 0.00 | 3,582 | -5.24 | ||||
| 2025-07-25 | 13F | SPC Financial, Inc. | 10,200 | 0.00 | 146 | -2.01 | ||||
| 2025-08-14 | 13F | Sunbelt Securities, Inc. | 0 | -100.00 | 0 | |||||
| 2025-07-07 | 13F | TruWealth Advisors, LLC | 42,803 | 0.00 | 614 | -2.23 | ||||
| 2025-08-13 | 13F | Marshall Wace, Llp | 0 | -100.00 | 0 | |||||
| 2025-08-14 | 13F | Old Mission Capital Llc | 10,484 | 150 | ||||||
| 2025-08-14 | 13F | Oxford Asset Management Llp | 19,526 | 280 | ||||||
| 2025-08-07 | 13F | HighPoint Advisor Group LLC | 85,860 | 0.60 | 1,231 | 1.65 | ||||
| 2025-08-14 | 13F | Atomi Financial Group, Inc. | 10,198 | 146 | ||||||
| 2025-08-14 | 13F | Aquatic Capital Management LLC | 0 | -100.00 | 0 | |||||
| 2025-07-29 | NP | GIMFX - GMO Implementation Fund | 11,776 | -67.11 | 173 | -68.90 | ||||
| 2025-08-14 | 13F | Beacon Investment Advisors Llc | 156,919 | 1.56 | 2,282 | 0.71 | ||||
| 2025-05-15 | 13F | Prelude Capital Management, Llc | Put | 0 | -100.00 | 0 | -100.00 | |||
| 2025-06-26 | NP | LSVQX - LSV Small Cap Value Fund Institutional Class Shares | 156,700 | 0.00 | 2,195 | -7.27 | ||||
| 2025-07-30 | 13F | Demars Financial Group, LLC | 32,411 | -92.84 | 465 | 1,446.67 | ||||
| 2025-08-14 | 13F | Chilton Investment Co Llc | 36,907 | 108.48 | 529 | 104.25 | ||||
| 2025-08-12 | 13F | Jpmorgan Chase & Co | 2,479,913 | 7.23 | 35,562 | 4.88 | ||||
| 2025-07-21 | 13F | DHJJ Financial Advisors, Ltd. | 3 | 0.00 | 0 | |||||
| 2025-08-12 | 13F | Global Retirement Partners, LLC | 8,115 | -58.94 | 116 | -61.07 | ||||
| 2025-07-17 | 13F | HB Wealth Management, LLC | 738,059 | -34.80 | 10,584 | -36.22 | ||||
| 2025-08-07 | 13F | Parkside Financial Bank & Trust | 10,735 | 1.42 | 154 | -1.29 | ||||
| 2025-07-30 | 13F | BlueChip Wealth Advisors LLC | 26,755 | 99.11 | 319 | 62.24 | ||||
| 2025-08-15 | 13F | CI Private Wealth, LLC | 1,733,402 | 38.77 | 24,957 | 35.55 | ||||
| 2025-08-11 | 13F | Core Wealth Partners LLC | 17,256 | 0.00 | 247 | -1.98 | ||||
| 2025-07-25 | 13F | Allspring Global Investments Holdings, LLC | 14,700 | 17.60 | 211 | 14.75 | ||||
| 2025-08-07 | 13F | Allen Investment Management LLC | 503,910 | 140.94 | 7,226 | 135.76 | ||||
| 2025-08-14 | 13F | Axa S.a. | 41,547 | 0.00 | 596 | -2.30 | ||||
| 2025-08-11 | 13F | Citigroup Inc | 3,714 | -90.76 | 53 | -91.00 | ||||
| 2025-08-13 | 13F | OMERS ADMINISTRATION Corp | 1,060,829 | 15,212 | ||||||
| 2025-08-13 | 13F | Garner Asset Management Corp | 99,072 | 14.18 | 1,421 | 11.64 | ||||
| 2025-08-14 | 13F | Goldman Sachs Group Inc | 2,049,801 | 6.52 | 29,394 | 4.19 | ||||
| 2025-08-14 | 13F | Main Street Financial Solutions, LLC | 11,314 | 1.35 | 162 | -0.61 | ||||
| 2025-06-30 | NP | PSP - Invesco Global Listed Private Equity ETF This fund is a listed as child fund of Invesco Ltd. and if that institution has disclosed ownership in this security, then these positions will not be double counted when calculating total shares and total value | 203,018 | 4.02 | 2,844 | -3.56 | ||||
| 2025-07-16 | 13F | Brown, Lisle/cummings, Inc. | 1,500 | 0.00 | 22 | 0.00 | ||||
| 2025-08-14 | 13F | Arete Wealth Advisors, LLC | 28,203 | -10.90 | 0 | |||||
| 2025-08-14 | 13F | Gen-Wealth Partners Inc | 250 | 0.00 | 4 | 0.00 | ||||
| 2025-07-28 | NP | FXED - Sound Enhanced Fixed Income ETF | 28,860 | 423 | ||||||
| 2025-08-14 | 13F | Schonfeld Strategic Advisors LLC | 0 | -100.00 | 0 | |||||
| 2025-07-09 | 13F | Pallas Capital Advisors LLC | 34,566 | 3.30 | 496 | 1.02 | ||||
| 2025-08-11 | 13F | Lsv Asset Management | 3,749,847 | -10.27 | 54 | -13.11 | ||||
| 2025-07-21 | 13F | HighMark Wealth Management LLC | 742 | 2.77 | 11 | 0.00 | ||||
| 2025-07-28 | 13F | Harbour Investments, Inc. | 527 | 0.00 | 8 | 0.00 | ||||
| 2025-08-11 | 13F | Rothschild Investment Llc | 107,799 | 8.56 | 1,546 | 6.19 | ||||
| 2025-08-14 | 13F | Ausdal Financial Partners, Inc. | 12,971 | 24.53 | 186 | 22.37 | ||||
| 2025-08-21 | NP | MOFTX - Mercer Opportunistic Fixed Income Fund Class I | 88,000 | 1,262 | ||||||
| 2025-08-14 | 13F | Bbr Partners, Llc | 10,305 | 148 | ||||||
| 2025-07-23 | 13F | PARK CIRCLE Co | 31,006 | 0.00 | 445 | -2.20 | ||||
| 2025-08-12 | 13F | Capricorn Investment Group LLC | 0 | -100.00 | 0 | |||||
| 2025-08-06 | 13F | Commonwealth Equity Services, Llc | 1,065,231 | 13.64 | 15 | 15.38 | ||||
| 2025-08-11 | 13F | Nordwand Advisors, LLC | 38,945 | 6.99 | 558 | 4.69 | ||||
| 2025-08-14 | 13F | Wealth Preservation Advisors, LLC | 199,661 | 1.33 | 2,863 | -0.87 | ||||
| 2025-08-06 | 13F | Black Swift Group, LLC | 28,500 | 7.55 | 409 | 5.15 | ||||
| 2025-07-30 | 13F | Crewe Advisors LLC | 11,966 | 0.00 | 172 | -2.29 | ||||
| 2025-08-13 | 13F | Guggenheim Capital Llc | 39,164 | 6.16 | 562 | 3.89 | ||||
| 2025-07-18 | 13F | Truist Financial Corp | 76,889 | 4.19 | 1,103 | 1.94 | ||||
| 2025-07-31 | 13F | Oppenheimer & Co Inc | 431,336 | 6.65 | 6,185 | 4.32 | ||||
| 2025-07-24 | 13F | Cascade Investment Group, Inc. | 21,075 | 0.00 | 302 | -1.95 | ||||
| 2025-05-15 | 13F | CAPROCK Group, Inc. | 34,179 | 60.45 | 514 | 55.93 | ||||
| 2025-08-14 | 13F | CTC Alternative Strategies, Ltd. | 12,300 | 17.14 | 176 | 15.03 | ||||
| 2025-07-16 | 13F | Perigon Wealth Management, LLC | 29,160 | -4.19 | 418 | -6.28 | ||||
| 2025-05-15 | 13F | Tudor Investment Corp Et Al | 0 | -100.00 | 0 | -100.00 | ||||
| 2025-07-23 | 13F | Kingswood Wealth Advisors, Llc | 121,559 | -7.71 | 1,743 | -10.57 | ||||
| 2025-07-29 | 13F | Carmel Capital Partners, LLC | 192,714 | 5.18 | 2,764 | 2.87 | ||||
| 2025-07-28 | 13F | Turtle Creek Wealth Advisors, LLC | 29,964 | -83.69 | 430 | -84.07 | ||||
| 2025-08-14 | 13F | D. E. Shaw & Co., Inc. | 595,025 | -37.60 | 8,533 | -38.97 | ||||
| 2025-08-14 | 13F | California State Teachers Retirement System | 16,445,728 | 0.00 | 235,832 | -2.18 | ||||
| 2025-08-13 | 13F | Mackenzie Financial Corp | 30,287 | -15.40 | 434 | -17.18 | ||||
| 2025-04-29 | 13F | Onyx Bridge Wealth Group LLC | 0 | -100.00 | 0 | |||||
| 2025-07-21 | 13F | Ameriflex Group, Inc. | 15,686 | -83.40 | 229 | -83.47 | ||||
| 2025-07-28 | 13F | BRYN MAWR TRUST Co | 1,500 | -42.11 | 22 | -43.24 | ||||
| 2025-08-15 | 13F | Lantern Wealth Advisors, LLC | 42,304 | 0.00 | 607 | -5.16 | ||||
| 2025-04-28 | 13F | Pinnacle Financial Partners Inc | 54,501 | 799 | ||||||
| 2025-08-14 | 13F | CoreCap Advisors, LLC | 610 | 9 | ||||||
| 2025-08-14 | 13F | VPR Management LLC | 14,609 | 209 | ||||||
| 2025-07-01 | 13F | Confluence Investment Management Llc | 311,648 | 2.23 | 4,469 | 0.00 | ||||
| 2025-07-25 | 13F | NorthRock Partners, LLC | 19,106 | 5.38 | 281 | 3.31 | ||||
| 2025-08-12 | 13F | Virtu Financial LLC | 0 | -100.00 | 0 | |||||
| 2025-08-13 | 13F | Plan Group Financial, LLC | 20,000 | 33.33 | 287 | 30.59 | ||||
| 2025-08-13 | 13F | Brown Advisory Inc | 37,029 | 0.00 | 531 | -2.21 | ||||
| 2025-08-08 | 13F | Hartland & Co., LLC | 3,649 | 38.27 | 52 | 36.84 | ||||
| 2025-08-11 | 13F | Strategic Wealth Partners, Ltd. | 68,849 | 0.38 | 987 | -5.91 | ||||
| 2025-08-27 | NP | BBVLX - Bridge Builder Large Cap Value Fund | 275,800 | 0.00 | 3,955 | -2.20 | ||||
| 2025-08-05 | 13F | Next Capital Management LLC | 39,363 | 0.00 | 564 | -2.25 | ||||
| 2025-04-30 | 13F | Arcus Capital Partners, LLC | 0 | -100.00 | 0 | -100.00 | ||||
| 2025-08-12 | 13F | Tradition Wealth Management, LLC | 203,411 | 0.85 | 2,917 | -1.35 | ||||
| 2025-08-12 | 13F | Trexquant Investment LP | 0 | -100.00 | 0 | |||||
| 2025-04-24 | 13F | Wingate Wealth Advisors, Inc. | 0 | -100.00 | 0 | |||||
| 2025-07-02 | 13F | Hamilton Lane Advisors Llc | 3,406,230 | 48,845 | ||||||
| 2025-07-14 | 13F | Sowell Financial Services LLC | 28,200 | 1.14 | 404 | -0.98 | ||||
| 2025-07-24 | 13F | Us Bancorp \de\ | 9,504 | 0.00 | 136 | -2.16 | ||||
| 2025-07-03 | 13F | Garde Capital, Inc. | 238 | 0.00 | 3 | 0.00 | ||||
| 2025-07-16 | 13F | Pictet & Cie (Europe) SA | 12,850 | 2.83 | 184 | 0.55 | ||||
| 2025-08-11 | 13F | VSM Wealth Advisory, LLC | 1,124 | 7.97 | 16 | 6.67 | ||||
| 2025-08-13 | 13F | FORA Capital, LLC | 0 | -100.00 | 0 | |||||
| 2025-08-14 | 13F | Verition Fund Management LLC | 28,643 | 69.18 | 411 | 65.32 | ||||
| 2025-05-08 | 13F | IFG Advisory, LLC | 0 | -100.00 | 0 | |||||
| 2025-07-18 | 13F | Trust Co Of Vermont | 1,200 | 0.00 | 17 | 0.00 | ||||
| 2025-07-23 | 13F | Steel Peak Wealth Management LLC | 52,525 | 17.28 | 773 | 14.88 | ||||
| 2025-08-13 | 13F | Advisor Group Holdings, Inc. | 1,036,398 | -1.10 | 15,626 | 1.72 | ||||
| 2025-08-14 | 13F/A | Barclays Plc | 621,854 | 153.98 | 9 | 166.67 | ||||
| 2025-08-08 | 13F | M&G Plc | 327,000 | -33.27 | 4,578 | -37.71 | ||||
| 2025-08-08 | 13F | Strategies Wealth Advisors, LLC | 33,446 | 2.62 | 480 | 0.42 | ||||
| 2025-08-14 | 13F | Jain Global LLC | 20,349 | 292 | ||||||
| 2025-08-12 | 13F | Entropy Technologies, LP | 64,806 | 929 | ||||||
| 2025-07-29 | 13F | Tweedy, Browne Co LLC | 29,515 | 119.75 | 423 | 115.82 | ||||
| 2025-06-24 | NP | QDF - FlexShares Quality Dividend Index Fund | 618,496 | 8,665 | ||||||
| 2025-05-01 | 13F | Reyes Financial Architecture, Inc. | 0 | -100.00 | 0 | |||||
| 2025-07-18 | 13F | Generali Investments CEE, investicni spolecnost, a.s. | 131,627 | 2.10 | 1,888 | -0.16 | ||||
| 2025-07-31 | 13F | CVA Family Office, LLC | 4,100 | 0.00 | 59 | -3.33 | ||||
| 2025-07-18 | 13F | Union Bancaire Privee, UBP SA | 67,828 | 5.08 | 143,296 | 15,047.57 | ||||
| 2025-08-12 | 13F | BlueStem Wealth Partners, LLC | 33,628 | 2.71 | 482 | 0.63 | ||||
| 2025-08-08 | 13F | Avantax Advisory Services, Inc. | 37,773 | 1.02 | 542 | -1.28 | ||||
| 2025-07-24 | NP | FADAX - Fidelity Advisor Dividend Growth Fund Class A This fund is a listed as child fund of Fmr Llc and if that institution has disclosed ownership in this security, then these positions will not be double counted when calculating total shares and total value | 2,190,452 | 45.55 | 32,090 | 37.93 | ||||
| 2025-07-07 | 13F | Versant Capital Management, Inc | 2,145 | -50.00 | 31 | -51.61 | ||||
| 2025-08-14 | 13F/A | Skopos Labs, Inc. | 24 | 0 | ||||||
| 2025-07-22 | 13F | IFS Advisors, LLC | 200 | 0.00 | 3 | 0.00 | ||||
| 2025-05-16 | 13F | Coppell Advisory Solutions LLC | 0 | -100.00 | 0 | |||||
| 2025-08-01 | 13F | Bessemer Group Inc | 161 | 0 | ||||||
| 2025-07-28 | 13F | Generali Asset Management SPA SGR | 4,377,807 | 2.12 | 62,778 | -0.11 | ||||
| 2025-08-19 | 13F | Newbridge Financial Services Group, Inc. | 2,794 | 1.23 | 40 | 0.00 | ||||
| 2025-07-25 | 13F | Acorn Creek Capital Llc | 20,492 | -23.92 | 294 | -25.63 | ||||
| 2025-08-05 | 13F | GPS Wealth Strategies Group, LLC | 2,755 | 0.00 | 40 | -2.50 | ||||
| 2025-07-15 | 13F | Fifth Third Bancorp | 1,000 | -65.78 | 14 | -66.67 | ||||
| 2025-08-05 | 13F | Huntington National Bank | 2,284 | -61.83 | 33 | -63.22 | ||||
| 2025-08-14 | 13F | Susquehanna International Group, Llp | 0 | -100.00 | 0 | |||||
| 2025-07-11 | 13F | Diversified Trust Co | 73,004 | 0.00 | 1,047 | -2.24 | ||||
| 2025-07-09 | 13F | Bank of New Hampshire | 500 | 7 | ||||||
| 2025-07-24 | 13F | Callan Family Office, LLC | 22,642 | 325 | ||||||
| 2025-08-14 | 13F | Ameriprise Financial Inc | 4,795,103 | -7.62 | 67,989 | -10.64 | ||||
| 2025-08-05 | 13F | Intellectus Partners, LLC | 173,303 | -2.70 | 2,549 | -4.78 | ||||
| 2025-08-14 | 13F | GWM Advisors LLC | 288,914 | -1.34 | 4,143 | -3.49 | ||||
| 2025-08-08 | 13F | Financial Gravity Companies, Inc. | 64,695 | 16.58 | 928 | 10.49 | ||||
| 2025-04-25 | 13F | Strid Group, LLC | 0 | -100.00 | 0 | |||||
| 2025-07-28 | 13F | Sagespring Wealth Partners, Llc | 11,379 | 163 | ||||||
| 2025-08-13 | 13F | Bridgewater Associates, LP | 12,305 | -65.04 | 176 | -65.83 | ||||
| 2025-08-14 | 13F | Toroso Investments, LLC | 29,180 | 418 | ||||||
| 2025-08-13 | 13F | Jones Financial Companies Lllp | 350 | -47.76 | 5 | -50.00 | ||||
| 2025-08-14 | 13F | Snowden Capital Advisors LLC | 18,557 | -1.36 | 273 | -3.55 | ||||
| 2025-07-29 | 13F | Stratos Wealth Partners, LTD. | 28,782 | 0.72 | 413 | -1.44 | ||||
| 2025-08-06 | 13F | Wedbush Securities Inc | 46,850 | 10.38 | 1 | |||||
| 2025-07-24 | 13F | Blair William & Co/il | 51,674 | 14.39 | 741 | 11.93 | ||||
| 2025-05-15 | 13F | Barclays Plc | Call | 0 | -100.00 | 0 | -100.00 | |||
| 2025-07-25 | 13F | Verdence Capital Advisors LLC | 12,880 | 185 | ||||||
| 2025-08-11 | 13F | Private Advisor Group, LLC | 78,504 | -25.28 | 1,126 | -26.95 | ||||
| 2025-05-30 | NP | ERNZ - TrueShares Active Yield ETF | 9,246 | 136 | ||||||
| 2025-08-13 | 13F | SCS Capital Management LLC | 687,962 | 0.00 | 10,120 | -2.14 | ||||
| 2025-08-14 | 13F | Bnp Paribas Arbitrage, Sa | 30,767 | -31.43 | 441 | -32.88 | ||||
| 2025-07-18 | 13F | Cooper Financial Group | 10,075 | -2.42 | 144 | -4.64 | ||||
| 2025-07-31 | 13F | Alamar Capital Management, LLC | 20,000 | 0.00 | 294 | -2.00 | ||||
| 2025-08-01 | 13F | Transcend Wealth Collective, Llc | 2,385,564 | -8.60 | 34,209 | -10.60 | ||||
| 2025-08-14 | 13F | LM Advisors LLC | 206,607 | 71.94 | 3 | 100.00 | ||||
| 2025-07-16 | 13F | Prairiewood Capital, LLC | 321,368 | 14.87 | 4,608 | 12.36 | ||||
| 2025-08-13 | 13F | Texas Capital Bank Wealth Management Services Inc | 288,755 | 2.07 | 4,141 | -0.17 | ||||
| 2025-08-14 | 13F | Citadel Advisors Llc | 0 | -100.00 | 0 | |||||
| 2025-05-14 | 13F | Luminist Capital LLC | 0 | -100.00 | 0 | |||||
| 2025-05-19 | 13F | Alpha DNA Investment Management LLC | 0 | -100.00 | 0 | |||||
| 2025-07-17 | 13F | CWA Asset Management Group, LLC | 25,464 | 365 | ||||||
| 2025-08-07 | 13F | Hennion & Walsh Asset Management, Inc. | 323,248 | 34.08 | 4,635 | 31.15 | ||||
| 2025-08-08 | 13F | Larson Financial Group LLC | 51 | 1 | ||||||
| 2025-07-30 | 13F | D.a. Davidson & Co. | 406,521 | 2.61 | 5,830 | 0.36 | ||||
| 2025-07-23 | 13F | Tcfg Wealth Management, Llc | 21,202 | 0.22 | 304 | -1.94 | ||||
| 2025-08-14 | 13F | IHT Wealth Management, LLC | 65,534 | 7.61 | 940 | 5.27 | ||||
| 2025-07-28 | 13F | Bayforest Capital Ltd | 1,086 | -78.28 | 16 | -79.45 | ||||
| 2025-07-29 | 13F | Stratos Wealth Advisors, LLC | 15,934 | -19.91 | 228 | -21.65 | ||||
| 2025-08-07 | 13F | Samalin Investment Counsel, LLC | 82,519 | 6.22 | 1,183 | 3.95 | ||||
| 2025-08-14 | 13F | Ieq Capital, Llc | 65,222 | -2.40 | 935 | -4.49 | ||||
| 2025-08-07 | 13F | Sierra Ocean, Llc | 1,618 | 0.00 | 23 | 0.00 | ||||
| 2025-07-28 | 13F | Sage Advisors, Llc | 2,218,614 | 3.57 | 31,815 | 1.31 | ||||
| 2025-08-14 | 13F | Van Eck Associates Corp | 12,607,175 | 2.94 | 181 | 0.56 | ||||
| 2025-05-15 | 13F | Aster Capital Management (DIFC) Ltd | 0 | -100.00 | 0 | |||||
| 2025-07-09 | 13F | Triumph Capital Management | 68,723 | 3.09 | 985 | 0.82 | ||||
| 2025-07-22 | 13F | Wealthcare Advisory Partners LLC | 26,837 | 41.86 | 385 | 38.63 | ||||
| 2025-07-25 | 13F | Welch Group, LLC | 18,758 | 2.71 | 269 | -2.19 | ||||
| 2025-06-26 | NP | FDGFX - Fidelity Dividend Growth Fund This fund is a listed as child fund of Fmr Llc and if that institution has disclosed ownership in this security, then these positions will not be double counted when calculating total shares and total value | 8,505,515 | 613.69 | 119,162 | 561.75 | ||||
| 2025-07-25 | 13F | GFS Advisors, LLC | 98,785 | 16.31 | 1,417 | 13.82 | ||||
| 2025-08-01 | 13F | Oarsman Capital, Inc. | 125,847 | -6.12 | 1,805 | -8.19 | ||||
| 2025-08-14 | 13F | Camden Capital, LLC | 774,976 | -4.77 | 11,113 | -6.84 | ||||
| 2025-08-13 | 13F | Beacon Pointe Advisors, LLC | 14,185 | 17.26 | 203 | 14.69 | ||||
| 2025-08-14 | 13F | Integrated Wealth Concepts LLC | 48,355 | 12.27 | 693 | 9.83 | ||||
| 2025-07-10 | 13F | Redhawk Wealth Advisors, Inc. | 68,289 | 9.72 | 979 | 7.35 | ||||
| 2025-07-25 | 13F | Total Clarity Wealth Management, Inc. | 0 | -100.00 | 0 | |||||
| 2025-08-08 | 13F | Cetera Investment Advisers | 250,323 | 18.80 | 3,590 | 16.22 | ||||
| 2025-08-14 | 13F | Granite FO LLC | 77,300 | 0.00 | 1,108 | -2.21 | ||||
| 2025-04-30 | 13F | BCJ Capital Management, LLC | 0 | -100.00 | 0 | |||||
| 2025-08-21 | NP | MSCQX - Mercer US Small/Mid Cap Equity Fund Class I | 107,100 | -26.19 | 1,536 | -27.83 | ||||
| 2025-08-04 | 13F | Muzinich & Co., Inc. | 1,455,433 | 37.54 | 20,871 | 34.53 | ||||
| 2025-05-16 | 13F | Empowered Funds, LLC | 0 | -100.00 | 0 | |||||
| 2025-08-05 | 13F | Bank of New York Mellon Corp | 117,189 | 0.71 | 1,680 | -1.47 | ||||
| 2025-08-14 | 13F | Two Sigma Investments, Lp | 0 | -100.00 | 0 | |||||
| 2025-08-11 | 13F | Principal Securities, Inc. | 900 | 13 | ||||||
| 2025-08-13 | 13F | Transce3nd, LLC | 7,647 | 0.00 | 110 | -2.68 | ||||
| 2025-07-14 | 13F | Golden State Equity Partners | 45,569 | -0.24 | 653 | -2.39 | ||||
| 2025-08-15 | 13F | Prevail Innovative Wealth Advisors, Llc | 138,181 | 14.19 | 1,982 | 11.67 | ||||
| 2025-08-11 | 13F | Dorsey & Whitney Trust CO LLC | 19,910 | 0.00 | 286 | -2.06 | ||||
| 2025-07-25 | 13F | Griffin Asset Management, Inc. | 14,821 | -10.25 | 213 | -12.40 | ||||
| 2025-07-16 | 13F | Eagle Global Advisors Llc | 61,230 | 81.99 | 878 | 78.09 | ||||
| 2025-04-17 | 13F | FNY Investment Advisers, LLC | 0 | -100.00 | 0 | |||||
| 2025-07-22 | 13F | MBL Wealth, LLC | 12,000 | -33.33 | 172 | -34.60 | ||||
| 2025-08-14 | 13F | Ancora Advisors, LLC | 24,052 | -90.60 | 345 | -85.56 | ||||
| 2025-05-14 | 13F | 1832 Asset Management L.P. | 0 | -100.00 | 0 | |||||
| 2025-07-17 | 13F | Sound Income Strategies, LLC | 3,294,183 | 4.47 | 47,239 | 2.19 | ||||
| 2025-08-04 | 13F | Keybank National Association/oh | 64,514 | -47.20 | 925 | -48.35 | ||||
| 2025-07-15 | 13F | Ballentine Partners, LLC | 29,328 | 0.00 | 421 | -2.10 | ||||
| 2025-05-09 | 13F | Hemington Wealth Management | 0 | -100.00 | 0 | |||||
| 2025-07-21 | 13F | Ameritas Advisory Services, LLC | 70 | 1 | ||||||
| 2025-07-28 | 13F | Naviter Wealth, LLC | 408,041 | 17.13 | 5,998 | 14.49 | ||||
| 2025-08-14 | 13F | Raymond James Financial Inc | 2,189,378 | 7.40 | 31,396 | 5.05 | ||||
| 2025-08-07 | 13F | CENTRAL TRUST Co | 636 | 2.75 | 9 | 0.00 | ||||
| 2025-08-13 | 13F | Lansforsakringar Fondforvaltning AB (publ) | 0 | -100.00 | 0 | |||||
| 2025-08-14 | 13F | Macquarie Group Ltd | 77,200 | 0.00 | 1,107 | -2.21 | ||||
| 2025-08-13 | 13F | Cary Street Partner Investment Advisory Llc | 4,403 | -24.13 | 63 | -25.88 | ||||
| 2025-07-29 | NP | COPY - Tweedy, Browne Insider + Value ETF | 18,423 | 146.56 | 270 | 133.91 | ||||
| 2025-08-12 | 13F | NWF Advisory Services Inc. | 49,662 | 16.68 | 728 | 10.47 | ||||
| 2025-08-12 | 13F | DnB Asset Management AS | 384,045 | -6.92 | 5,507 | -8.95 | ||||
| 2025-08-04 | 13F | Savvy Advisors, Inc. | 12,153 | -19.15 | 174 | -20.91 | ||||
| 2025-05-09 | 13F | Headlands Technologies LLC | 0 | -100.00 | 0 | |||||
| 2025-07-23 | 13F | Tectonic Advisors Llc | 767,005 | 14.46 | 10,999 | 11.96 | ||||
| 2025-07-14 | 13F | UMA Financial Services, Inc. | 359 | 0.00 | 5 | 0.00 | ||||
| 2025-08-14 | 13F/A | Rockefeller Capital Management L.P. | 656,632 | 7.64 | 9,416 | 5.30 | ||||
| 2025-08-19 | 13F | Cape Investment Advisory, Inc. | 500 | 0.00 | 7 | 0.00 | ||||
| 2025-07-24 | 13F | IFP Advisors, Inc | 1,167 | 17 | ||||||
| 2025-08-11 | 13F | Nomura Asset Management Co Ltd | 40,777 | -5.01 | 585 | -7.15 | ||||
| 2025-07-03 | 13F | Trinity Financial Advisors LLC | 1,150,853 | 2.25 | 16,929 | 1.93 | ||||
| 2025-08-14 | 13F | Silvercrest Asset Management Group Llc | 0 | -100.00 | 0 | |||||
| 2025-08-14 | 13F | Manufacturers Life Insurance Company, The | 13,914 | -46.34 | 200 | -47.63 | ||||
| 2025-07-29 | 13F | Liberty Square Wealth Partners Llc | 25,111 | 0.00 | 360 | -2.17 | ||||
| 2025-08-08 | 13F | SBI Securities Co., Ltd. | 9,021 | 0.88 | 129 | -1.53 | ||||
| 2025-08-12 | 13F | Franklin Resources Inc | 1,769,995 | 0.11 | 25,382 | -2.07 | ||||
| 2025-07-29 | NP | GBFFX - GMO Benchmark-Free Fund Class III | 5,174 | -68.24 | 76 | -70.12 | ||||
| 2025-08-08 | 13F | Kingsview Wealth Management, LLC | 30,856 | 0.02 | 442 | -2.21 | ||||
| 2025-07-25 | 13F | Atria Wealth Solutions, Inc. | 52,651 | -30.23 | 774 | -31.38 | ||||
| 2025-07-28 | 13F | Dixon Fnancial Services, Inc. | 21,250 | 0.00 | 305 | -2.25 | ||||
| 2025-07-17 | 13F | Janney Montgomery Scott LLC | 2,138,636 | 13.30 | 31 | 11.11 | ||||
| 2025-07-09 | 13F | Channel Wealth Llc | 36,965 | -15.22 | 530 | -17.06 | ||||
| 2025-08-12 | 13F/A | Boston Partners | 2,002,537 | -1.31 | 28,669 | -2.71 | ||||
| 2025-08-14 | 13F | Barnett & Company, Inc. | 137,950 | 14.86 | 1,978 | 12.39 | ||||
| 2025-08-07 | 13F | Midwest Trust Co | 19,353 | 278 | ||||||
| 2025-08-13 | 13F | Cerity Partners LLC | 454,355 | -15.88 | 6,515 | -17.72 | ||||
| 2025-07-30 | 13F | Castle Wealth Management Llc | 25,877 | 36.88 | 381 | 33.80 | ||||
| 2025-07-14 | 13F | GAMMA Investing LLC | 62 | 0.00 | 1 | |||||
| 2025-04-28 | 13F | Redmont Wealth Advisors Llc | 6,682 | 98 | ||||||
| 2025-08-05 | 13F | Burney Co/ | 13,201 | 0.00 | 189 | -2.07 | ||||
| 2025-08-07 | 13F | Verus Capital Partners, Llc | 91,354 | -4.37 | 1,310 | -6.43 | ||||
| 2025-08-12 | 13F | CIBC Private Wealth Group, LLC | 19,074 | 0.99 | 274 | 16.17 | ||||
| 2025-07-31 | 13F | Buckingham Strategic Partners | 38,148 | 96.39 | 547 | 92.61 | ||||
| 2025-08-05 | 13F | Partners Group Holding AG | 0 | -100.00 | 0 | |||||
| 2025-08-27 | 13F/A | Squarepoint Ops LLC | 93,691 | 133.77 | 1,344 | 128.79 | ||||
| 2025-08-11 | 13F | NewEdge Wealth, LLC | 287,511 | 14.91 | 4,048 | 10.36 | ||||
| 2025-07-31 | 13F | Sumitomo Mitsui Trust Holdings, Inc. | 1,283,332 | 25.07 | 18,403 | 22.35 | ||||
| 2025-08-15 | 13F | Great West Life Assurance Co /can/ | 508,345 | 3.79 | 7 | 0.00 | ||||
| 2025-08-14 | 13F | Two Sigma Advisers, Lp | 44,200 | -24.19 | 634 | -25.88 | ||||
| 2025-07-07 | 13F | Teamwork Financial Advisors, LLC | 20,839 | 0.20 | 299 | -1.97 | ||||
| 2025-08-25 | 13F/A | Neuberger Berman Group LLC | 51,767 | 5.46 | 742 | 3.20 | ||||
| 2025-08-08 | 13F | Creative Planning | 1,076,071 | -24.92 | 15,431 | -26.57 | ||||
| 2025-08-15 | 13F | Tower Research Capital LLC (TRC) | 1,904 | 209.09 | 27 | 200.00 | ||||
| 2025-08-12 | 13F | Edmond De Rothschild Holding S.a. | 3,874 | 0.00 | 56 | -1.79 | ||||
| 2025-08-06 | 13F | Texas Yale Capital Corp. | 22,280 | 74.33 | 319 | 70.59 | ||||
| 2025-08-11 | 13F | Blue Owl Capital Holdings LP | 2,045,070 | 0.00 | 29,326 | -2.18 | ||||
| 2025-08-27 | NP | VQNPX - Vanguard Growth and Income Fund Investor Shares This fund is a listed as child fund of Vanguard Group Inc and if that institution has disclosed ownership in this security, then these positions will not be double counted when calculating total shares and total value | 309,209 | -27.96 | 4,434 | -29.53 | ||||
| 2025-08-14 | 13F | Horizon Investments, LLC | 16 | 0.00 | 0 | |||||
| 2025-07-09 | 13F | Byrne Asset Management LLC | 1,400 | 20 | ||||||
| 2025-07-25 | 13F | Oregon Public Employees Retirement Fund | 15,853,675 | -1.52 | 227,342 | -3.67 | ||||
| 2025-08-01 | 13F | Financial Counselors Inc | 0 | -100.00 | 0 | |||||
| 2025-08-15 | 13F | Kensington Investment Counsel, LLC | 11,971 | 0.00 | 172 | -2.29 | ||||
| 2025-05-06 | 13F | Kovack Advisors, Inc. | 0 | -100.00 | 0 | |||||
| 2025-07-14 | 13F | U.S. Capital Wealth Advisors, LLC | 100,393 | 3.52 | 1,440 | 1.27 | ||||
| 2025-08-14 | 13F | Hilltop Holdings Inc. | 14,580 | 209 | ||||||
| 2025-08-04 | 13F | Hantz Financial Services, Inc. | 42 | 2.44 | 0 | |||||
| 2025-08-13 | 13F | First Trust Advisors Lp | 0 | -100.00 | 0 | |||||
| 2025-05-19 | 13F/A | Kovitz Investment Group Partners, LLC | 0 | -100.00 | 0 | -100.00 | ||||
| 2025-07-29 | NP | SGMAX - SIIT Global Managed Volatility Fund Class A | 223,500 | 0.00 | 3,274 | -5.24 | ||||
| 2025-08-15 | 13F | WealthCollab, LLC | 0 | -100.00 | 0 | |||||
| 2025-08-07 | 13F | Atala Financial Inc | 24,985 | -7.78 | 358 | -9.82 | ||||
| 2025-05-08 | 13F | Us Financial Advisors, Llc | 10,770 | 0.00 | 158 | -3.09 | ||||
| 2025-07-25 | 13F | Concurrent Investment Advisors, LLC | 231,992 | 15.30 | 3,327 | 12.78 | ||||
| 2025-05-15 | 13F/A | Cooperman Leon G | 0 | -100.00 | 0 | -100.00 | ||||
| 2025-07-30 | 13F | Avidian Wealth Solutions, LLC | 53,918 | 773 | ||||||
| 2025-08-08 | 13F | Condor Capital Management | 314,230 | -14.24 | 4,506 | -16.11 | ||||
| 2025-05-14 | 13F | Credit Agricole S A | 151,653 | 102.79 | 2,223 | 96.73 | ||||
| 2025-08-04 | 13F | Premier Path Wealth Partners, LLC | 14,000 | 0.00 | 201 | -2.44 | ||||
| 2025-08-18 | 13F | Wolverine Trading, Llc | Call | 39,400 | 573 | |||||
| 2025-08-13 | 13F | Millstone Evans Group, LLC | 5,000 | 0.00 | 72 | -2.74 | ||||
| 2025-08-18 | 13F | Wolverine Trading, Llc | Put | 16,700 | 243 | |||||
| 2025-08-14 | 13F | Bramshill Investments, LLC | 50,008 | -0.25 | 717 | -2.32 | ||||
| 2025-08-08 | 13F | Wall Street Access Asset Management, LLC | 30,992 | 1.13 | 444 | -0.89 | ||||
| 2025-08-12 | 13F | O'shaughnessy Asset Management, Llc | 30,429 | -27.19 | 436 | -28.76 | ||||
| 2025-08-11 | 13F | HighTower Advisors, LLC | 949,827 | 11.09 | 13,621 | 8.67 | ||||
| 2025-07-17 | 13F | Beacon Capital Management, LLC | 838 | 2.82 | 12 | 9.09 | ||||
| 2025-08-14 | 13F | Aqr Capital Management Llc | 14,499 | -21.02 | 208 | -23.05 | ||||
| 2025-08-15 | 13F | Captrust Financial Advisors | 11,773 | -7.39 | 169 | -9.68 | ||||
| 2025-08-06 | 13F | Fox Run Management, L.l.c. | 0 | -100.00 | 0 | |||||
| 2025-08-12 | 13F | Bokf, Na | 0 | -100.00 | 0 | |||||
| 2025-08-13 | 13F | Baird Financial Group, Inc. | 11,460 | 0.01 | 164 | -1.80 | ||||
| 2025-08-11 | 13F | Intrust Bank Na | 354,546 | -17.68 | 5,084 | -19.47 | ||||
| 2025-08-06 | 13F | Ethos Financial Group, LLC | 47,328 | 12.45 | 679 | 10.05 | ||||
| 2025-08-11 | 13F | Avantax Planning Partners, Inc. | 72,540 | -7.46 | 1,040 | -9.49 | ||||
| 2025-07-11 | 13F | Seacrest Wealth Management, Llc | 91,815 | -25.79 | 1,317 | -27.41 | ||||
| 2025-08-11 | 13F | United Capital Financial Advisers, Llc | 300,903 | 0.03 | 4,315 | -2.15 | ||||
| 2025-08-14 | 13F | Sentinus, LLC | 611,852 | 9.09 | 8,774 | 6.70 | ||||
| 2025-08-12 | 13F | Steward Partners Investment Advisory, Llc | 333,138 | 10.77 | 4,777 | 8.37 | ||||
| 2025-05-02 | 13F | Bailard, Inc. | 0 | -100.00 | 0 | |||||
| 2025-08-13 | 13F | Legacy Capital Wealth Partners, LLC | 91,136 | -2.54 | 1,307 | -4.67 | ||||
| 2025-07-30 | 13F | Cullen/frost Bankers, Inc. | 0 | -100.00 | 0 | |||||
| 2025-07-11 | 13F | Mandatum Life Insurance Co Ltd | 35,861 | -23.59 | 514 | -25.29 | ||||
| 2025-05-15 | 13F | Lazard Asset Management Llc | 0 | -100.00 | 0 | |||||
| 2025-08-12 | 13F | Magnetar Financial LLC | 0 | -100.00 | 0 | |||||
| 2025-08-14 | 13F | Summit Trail Advisors, Llc | 0 | -100.00 | 0 | |||||
| 2025-07-08 | 13F | Parallel Advisors, LLC | 14,250 | -6.56 | 204 | -8.93 | ||||
| 2025-05-07 | 13F | Spectrum Wealth Counsel, LLC | 382 | 12.35 | 6 | 0.00 | ||||
| 2025-07-31 | 13F | Wealthfront Advisers Llc | 22,898 | 328 | ||||||
| 2025-08-13 | 13F | Northwestern Mutual Wealth Management Co | 1,273 | 27.30 | 18 | 28.57 | ||||
| 2025-08-13 | 13F | Cresset Asset Management, LLC | 7,536,875 | -8.63 | 110,548 | -10.83 | ||||
| 2025-05-20 | 13F/A | Colony Group, LLC | 0 | -100.00 | 0 | |||||
| 2025-08-14 | 13F | Jane Street Group, Llc | Call | 60,500 | 868 | |||||
| 2025-08-14 | 13F | Jane Street Group, Llc | 89,818 | -50.02 | 1,288 | -51.14 | ||||
| 2025-07-17 | 13F | Kavar Capital Partners Group, Llc | 16,465 | 236 | ||||||
| 2025-08-14 | 13F | Ares Management Llc | 2,487,964 | 6.47 | 35,677 | 4.15 | ||||
| 2025-07-23 | 13F | Winthrop Advisory Group LLC | 53,814 | -5.94 | 792 | -7.92 | ||||
| 2025-08-01 | 13F | State of New Jersey Common Pension Fund E | 0 | -100.00 | 0 | |||||
| 2025-08-14 | 13F | Comerica Bank | 57,971 | -3.63 | 831 | -5.68 | ||||
| 2025-08-14 | 13F | Susquehanna International Group, Llp | Put | 78,200 | -35.32 | 1,121 | -36.74 | |||
| 2025-08-14 | 13F | Susquehanna International Group, Llp | Call | 405,600 | -25.59 | 5,816 | -27.22 | |||
| 2025-06-24 | NP | QDEF - FlexShares Quality Dividend Defensive Index Fund | 136,417 | 1,911 | ||||||
| 2025-08-15 | 13F | Northeast Financial Consultants Inc | 419,016 | -21.17 | 6,009 | -22.90 | ||||
| 2025-08-14 | 13F | Engineers Gate Manager LP | 0 | -100.00 | 0 | |||||
| 2025-07-29 | 13F | Robert Wood Johnson Foundation | 4,218,864 | 0.00 | 60,499 | -2.18 | ||||
| 2025-07-29 | 13F | Private Trust Co Na | 3,123 | 86.56 | 45 | 83.33 | ||||
| 2025-06-26 | NP | LSVEX - LSV VALUE EQUITY FUND Institutional Class Shares | 276,600 | 0.00 | 3,875 | -7.27 | ||||
| 2025-07-23 | 13F | Hager Investment Management Services, Llc | 6,400 | 0.00 | 92 | -2.15 | ||||
| 2025-07-23 | 13F | Prime Capital Investment Advisors, LLC | 20,938 | -15.36 | 300 | -17.13 | ||||
| 2025-07-24 | 13F | Standard Life Aberdeen plc | 202,091 | 3.96 | 2,893 | 2.01 | ||||
| 2025-08-14 | 13F | Enstar Group LTD | 709,175 | 2.84 | 10,170 | 0.59 | ||||
| 2025-08-04 | 13F | Canton Hathaway, LLC | 0 | -100.00 | 0 | |||||
| 2025-08-14 | 13F | Hrt Financial Lp | 182,507 | -54.85 | 3 | -60.00 | ||||
| 2025-07-11 | 13F | Quad-Cities Investment Group, LLC | 10,544 | 2.05 | 151 | 0.00 | ||||
| 2025-08-14 | 13F | Mercer Global Advisors Inc /adv | 46,838 | 155.23 | 672 | 149.44 | ||||
| 2025-07-17 | 13F | Sterneck Capital Management, LLC | 21,221 | 36.37 | 304 | 33.33 | ||||
| 2025-08-14 | 13F | Diversify Advisory Services, LLC | 16,484 | 24.09 | 235 | 25.00 | ||||
| 2025-08-13 | 13F | Invesco Ltd. | 268,090 | -2.65 | 3,844 | -4.78 | ||||
| 2025-07-16 | 13F | NovaPoint Capital, LLC | 28,003 | -3.45 | 402 | -5.65 | ||||
| 2025-07-31 | 13F | Whipplewood Advisors, LLC | 68,179 | 158,455.81 | 978 | 69.91 | ||||
| 2025-08-14 | 13F | Vivaldi Capital Management, LLC | 0 | -100.00 | 0 | |||||
| 2025-07-25 | 13F | Envestnet Portfolio Solutions, Inc. | 0 | -100.00 | 0 | |||||
| 2025-08-13 | 13F | Callodine Capital Management, LP | 325,000 | 0.00 | 4,660 | -2.18 | ||||
| 2025-04-29 | 13F | Raleigh Capital Management Inc. | 0 | -100.00 | 0 | |||||
| 2025-05-14 | 13F | Catalyst Funds Management Pty Ltd | 0 | -100.00 | 0 | |||||
| 2025-07-16 | 13F | Signaturefd, Llc | 20,877 | -7.60 | 299 | -9.67 | ||||
| 2025-07-10 | 13F | Exchange Traded Concepts, Llc | 29,515 | 171.88 | 423 | 166.04 | ||||
| 2025-05-15 | 13F | Parvin Asset Management, LLC | 0 | -100.00 | 0 | |||||
| 2025-08-12 | 13F | Chaney Capital Management, Inc. | 100,840 | 0.00 | 1,446 | -2.17 | ||||
| 2025-08-05 | 13F | Obermeyer Wood Investment Counsel, Lllp | 164,270 | 13.75 | 2,356 | 11.24 | ||||
| 2025-08-14 | 13F | Smartleaf Asset Management LLC | 197 | 3 | ||||||
| 2025-08-13 | 13F | Rsm Us Wealth Management Llc | 73,822 | -0.35 | 1,087 | -2.43 | ||||
| 2025-08-13 | 13F | Grantham, Mayo, Van Otterloo & Co. LLC | 102,189 | -27.47 | 1,465 | -29.06 | ||||
| 2025-07-16 | 13F | Register Financial Advisors LLC | 15,475 | -0.66 | 222 | -3.07 | ||||
| 2025-08-13 | 13F | EverSource Wealth Advisors, LLC | 8,728 | 106.14 | 125 | 101.61 | ||||
| 2025-08-07 | 13F | Zions Bancorporation, National Association /ut/ | 4,000 | 0.00 | 57 | -1.72 | ||||
| 2025-05-15 | 13F | Gwn Securities Inc. | 0 | -100.00 | 0 | |||||
| 2025-08-11 | 13F | Heritage Wealth Advisors | 2,400 | 0.00 | 34 | -2.86 | ||||
| 2025-05-08 | 13F | CAP Partners, LLC | 0 | -100.00 | 0 | |||||
| 2025-07-29 | 13F | Arista Wealth Management, LLC | 15,491 | 222 | ||||||
| 2025-05-14 | 13F | ExodusPoint Capital Management, LP | 0 | -100.00 | 0 | |||||
| 2025-08-11 | 13F | Greenland Capital Management LP | Call | 0 | -100.00 | 0 | -100.00 | |||
| 2025-08-12 | 13F | One Charles Private Wealth Services, LLC | 17,478 | 24.72 | 251 | 21.95 | ||||
| 2025-08-14 | 13F | Evercore Wealth Management, LLC | 39,800 | -7.66 | 571 | -9.67 | ||||
| 2025-08-21 | NP | BIZD - VanEck Vectors BDC Income ETF | 12,107,931 | 0.70 | 173,628 | -1.50 | ||||
| 2025-08-04 | 13F | Arkadios Wealth Advisors | 158,950 | 5.12 | 2,279 | 2.84 | ||||
| 2025-08-05 | 13F | Palogic Value Management, L.P. | 138,912 | 0.25 | 1,992 | -1.97 | ||||
| 2025-08-01 | 13F | Austin Private Wealth, LLC | 17,262 | 1.41 | 248 | -0.80 | ||||
| 2025-08-06 | 13F | Baillie Gifford & Co | 0 | -100.00 | 0 | |||||
| 2025-08-14 | 13F | UBS Group AG | 5,384,148 | 81.61 | 77,209 | 77.65 | ||||
| 2025-08-15 | 13F | Kestra Advisory Services, LLC | 62,285 | 119.76 | 893 | 115.18 | ||||
| 2025-08-14 | 13F | Oxford Financial Group Ltd | 20,487 | 0.00 | 294 | -2.33 | ||||
| 2025-07-30 | NP | HYIN - WisdomTree Alternative Income Fund N/A | 117,907 | 12.75 | 1,727 | 6.87 | ||||
| 2025-08-14 | 13F | Fort Point Capital Partners LLC | 25,854 | 0.00 | 380 | 0.26 | ||||
| 2025-08-01 | 13F | Envestnet Asset Management Inc | 138,171 | 1.05 | 1,981 | -1.15 | ||||
| 2025-08-13 | 13F | Johnson Financial Group, Inc. | 499,857 | -21.62 | 7,345 | -23.27 | ||||
| 2025-08-08 | 13F | Foundations Investment Advisors, LLC | 19,878 | 285 | ||||||
| 2025-08-14 | 13F | Wiley Bros.-aintree Capital, Llc | 12,203 | 1.56 | 175 | -3.33 | ||||
| 2025-07-08 | 13F/A | Adams Asset Advisors, LLC | 100,430 | 44.39 | 1,440 | 41.32 | ||||
| 2025-07-01 | 13F | GP Brinson Investments LLC | 336,832 | 0.00 | 4,830 | -2.17 | ||||
| 2025-08-12 | 13F | Cornerstone Wealth Management, LLC | 37,128 | -1.76 | 532 | -3.97 | ||||
| 2025-08-13 | 13F | Northern Trust Corp | 213,028 | -71.74 | 3,055 | -72.36 | ||||
| 2025-08-14 | 13F | Stifel Financial Corp | 1,074,149 | 8.58 | 15,403 | 6.21 | ||||
| 2025-08-12 | 13F | Integrated Advisors Network LLC | 12,550 | 180 | ||||||
| 2025-08-05 | 13F | Magnolia Capital Advisors Llc | 133,827 | 7.09 | 1,919 | 4.75 | ||||
| 2025-07-25 | 13F | LRI Investments, LLC | 559 | 2.76 | 8 | 14.29 | ||||
| 2025-08-05 | 13F | Bard Associates Inc | 67,785 | -0.33 | 997 | -2.45 | ||||
| 2025-07-30 | 13F | Brookstone Capital Management | 98,655 | -2.88 | 1,415 | -5.04 | ||||
| 2025-08-07 | 13F | Allworth Financial LP | 3,695 | 24,533.33 | 53 | |||||
| 2025-08-19 | 13F | Anchor Investment Management, LLC | 3,000 | 0.00 | 43 | 0.00 | ||||
| 2025-07-24 | 13F | Ronald Blue Trust, Inc. | 9,868 | -29.24 | 142 | -30.88 | ||||
| 2025-08-07 | 13F | Global Wealth Management Investment Advisory, Inc. | 75,602 | 8.09 | 1,084 | 5.76 | ||||
| 2025-05-08 | 13F | XTX Topco Ltd | 0 | -100.00 | 0 | |||||
| 2025-07-09 | 13F | Epiq Partners, Llc | 486,784 | 7.37 | 6,980 | 5.03 | ||||
| 2025-08-14 | 13F | Citadel Advisors Llc | Call | 14,900 | 86.25 | 214 | 82.05 | |||
| 2025-08-14 | 13F | Citadel Advisors Llc | Put | 66,000 | -48.96 | 946 | -50.08 | |||
| 2025-08-14 | 13F | Turim 21 Investimentos Ltda. | 15,416 | 0.00 | 221 | -1.78 | ||||
| 2025-06-12 | 13F/A | Deutsche Bank Ag\ | 0 | -100.00 | 0 | |||||
| 2025-07-16 | 13F | Beaumont Financial Advisors, LLC | 10,305 | 2.82 | 148 | 0.68 | ||||
| 2025-08-01 | 13F | Y-Intercept (Hong Kong) Ltd | 0 | -100.00 | 0 | |||||
| 2025-07-11 | 13F | Pinnacle Bancorp, Inc. | 1,175 | 0.00 | 17 | -5.88 | ||||
| 2025-07-30 | 13F | Jackson Thornton Asset Management, Llc | 14,499 | -21.02 | 209 | -17.72 | ||||
| 2025-08-13 | 13F | Truvestments Capital Llc | 299,101 | -0.41 | 4,289 | -2.59 | ||||
| 2025-08-14 | 13F | Federation des caisses Desjardins du Quebec | 16,956 | 14.79 | 243 | 12.50 | ||||
| 2025-08-01 | 13F | Trust Investment Advisors | 59,044 | 0.42 | 847 | -1.74 | ||||
| 2025-08-04 | 13F | Amplius Wealth Advisors, LLC | 18,320 | -58.32 | 263 | -59.32 | ||||
| 2025-08-12 | 13F | Jefferies Financial Group Inc. | 16,093 | 0.00 | 231 | -2.13 | ||||
| 2025-08-14 | 13F | Qube Research & Technologies Ltd | 0 | -100.00 | 0 | |||||
| 2025-07-22 | 13F | Sage Investment Counsel LLC | 13,355 | 8.48 | 192 | 6.11 | ||||
| 2025-07-31 | 13F | Caitong International Asset Management Co., Ltd | 795 | -81.00 | 11 | -81.97 | ||||
| 2025-08-08 | 13F | Accredited Investors Inc. | 31,628 | 90.21 | 454 | 86.42 | ||||
| 2025-07-14 | 13F | Border to Coast Pensions Partnership Ltd | 1,300,000 | 4.00 | 19 | 0.00 | ||||
| 2025-08-07 | 13F | Evoke Wealth, Llc | 10,485 | 0.00 | 154 | -1.91 | ||||
| 2025-07-25 | 13F | Cwm, Llc | 1,448 | 2.48 | 0 | |||||
| 2025-07-18 | 13F | SOA Wealth Advisors, LLC. | 0 | -100.00 | 0 | |||||
| 2025-08-12 | 13F | Mcdonald Partners Llc | 30,000 | 0.00 | 430 | -2.05 | ||||
| 2025-08-11 | 13F | Synergy Investment Management, LLC | 0 | -100.00 | 0 | |||||
| 2025-08-11 | 13F | Perennial Investment Advisors, LLC | 419,418 | 3.67 | 6,014 | 1.40 | ||||
| 2025-08-14 | 13F | Corient IA LLC | 10,000 | 0.00 | 143 | -2.05 | ||||
| 2025-08-11 | 13F | EMC Capital Management | 10,655 | 0 | ||||||
| 2025-07-30 | 13F | Denali Advisors Llc | 630,218 | -2.39 | 9,037 | -4.52 | ||||
| 2025-07-29 | 13F | Chicago Partners Investment Group LLC | 588,652 | 3.11 | 8,800 | 12.43 | ||||
| 2025-08-14 | 13F | Millennium Management Llc | 146,126 | -86.73 | 2,095 | -87.02 | ||||
| 2025-05-28 | 13F | Silicon Valley Capital Partners | 10,337 | 2.81 | 155 | 1.97 | ||||
| 2025-08-01 | 13F | Pasadena Private Wealth, LLC | 10,764 | -73.16 | 154 | -73.76 | ||||
| 2025-08-14 | 13F | Mml Investors Services, Llc | 108,918 | 25.15 | 2 | 0.00 | ||||
| 2025-08-14 | 13F | Millennium Management Llc | Put | 90,000 | 0.00 | 1,291 | -2.20 | |||
| 2025-05-14 | 13F | Monterey Private Wealth, Inc. | 10,344 | 152 | ||||||
| 2025-08-12 | 13F | Insigneo Advisory Services, Llc | 51,031 | 21.67 | 732 | 19.06 | ||||
| 2025-07-11 | 13F | Kingstone Capital Partners Texas, LLC | 52,098,372 | 735 | ||||||
| 2025-08-12 | 13F | Pathstone Holdings, LLC | 15,931 | -0.01 | 228 | -2.15 | ||||
| 2025-08-14 | 13F | AllSquare Wealth Management LLC | 1,400 | 0.00 | 20 | 0.00 | ||||
| 2025-08-13 | 13F | Gabelli Funds Llc | 0 | -100.00 | 0 | |||||
| 2025-07-29 | 13F | Stephens Inc /ar/ | 3,032,304 | 1.40 | 43,483 | -0.81 | ||||
| 2025-08-05 | 13F | BCGM Wealth Management, LLC | Put | 31,000 | 0 | |||||
| 2025-04-25 | 13F | Albion Financial Group /ut | 0 | -100.00 | 0 | |||||
| 2025-08-04 | 13F | Strs Ohio | 2,023,712 | 2.84 | 29,020 | 0.60 | ||||
| 2025-05-13 | 13F | Clear Street Markets Llc | 0 | -100.00 | 0 | |||||
| 2025-07-28 | 13F | Allianz Asset Management GmbH | 20,196 | -43.48 | 290 | -44.74 | ||||
| 2025-08-14 | 13F | Wells Fargo & Company/mn | 1,387,808 | 5.90 | 19,901 | 3.59 | ||||
| 2025-07-22 | 13F | Valeo Financial Advisors, LLC | 34,733 | -48.03 | 498 | -49.13 |